What Can DP Do too? | Deep Learning Modeling of Oxygen Redistribution and Thermal Transport in Silicon on Insulator and Buried Oxide Layers
In silicon-on-insulator (SOI) technology, the core challenge of the separation by implanted oxygen (SIMOX) process lies in precisely controlling the thickness and oxygen distribution of the buried oxide (BOX) layer and understanding cross-interface thermal transport behavior. Traditional methods often suffer from limited accuracy or efficiency in predicting oxygen diffusion dynamics, layer thickness evolution, and interfacial thermal resistance during post-implantation annealing. Recently, a team led by Prof. Guangping Zheng and Dr. Jiashu Chen from the Department of Mechanical Engineering at The Hong Kong Polytechnic University, in collaboration with Prof. Zhuo Tang’s group from the College of Information Science and Engineering, Hunan University, published a research achievement in Communications Materials (IF=9.6) titled “Deep learning modeling of oxygen redistribution and thermal transport in silicon on insulator and buried oxide layers”. They proposed a computational framework integrating deep neural network potential with molecular dynamics (DFT-MD + DP), systematically addressing the multiscale modeling challenges from oxygen implantation and diffusion to interfacial heat transport.
High-Accuracy DP Model: Bridging the Gap Between Quantum Precision and Classical Efficiency
The study first constructed a Deep Potential (DP) model for the Si–O system. To validate its structural description accuracy, the team compared the radial distribution functions (RDFs) calculated via ab initio molecular dynamics (AIMD), classical molecular dynamics (CMD), and the current DP model. For amorphous silica, the root-mean-square error (RMSE) of the RDF from DeePMD was 0.142 Å, a 76% improvement over CMD’s 0.602 Å; in the more structurally complex c-Si/a-SiO₂ interface region, the DP model reduced the error from CMD’s 0.775 Å to 0.157 Å, achieving an 80% precision improvement (see Fig. 1a, 2c, 2e).
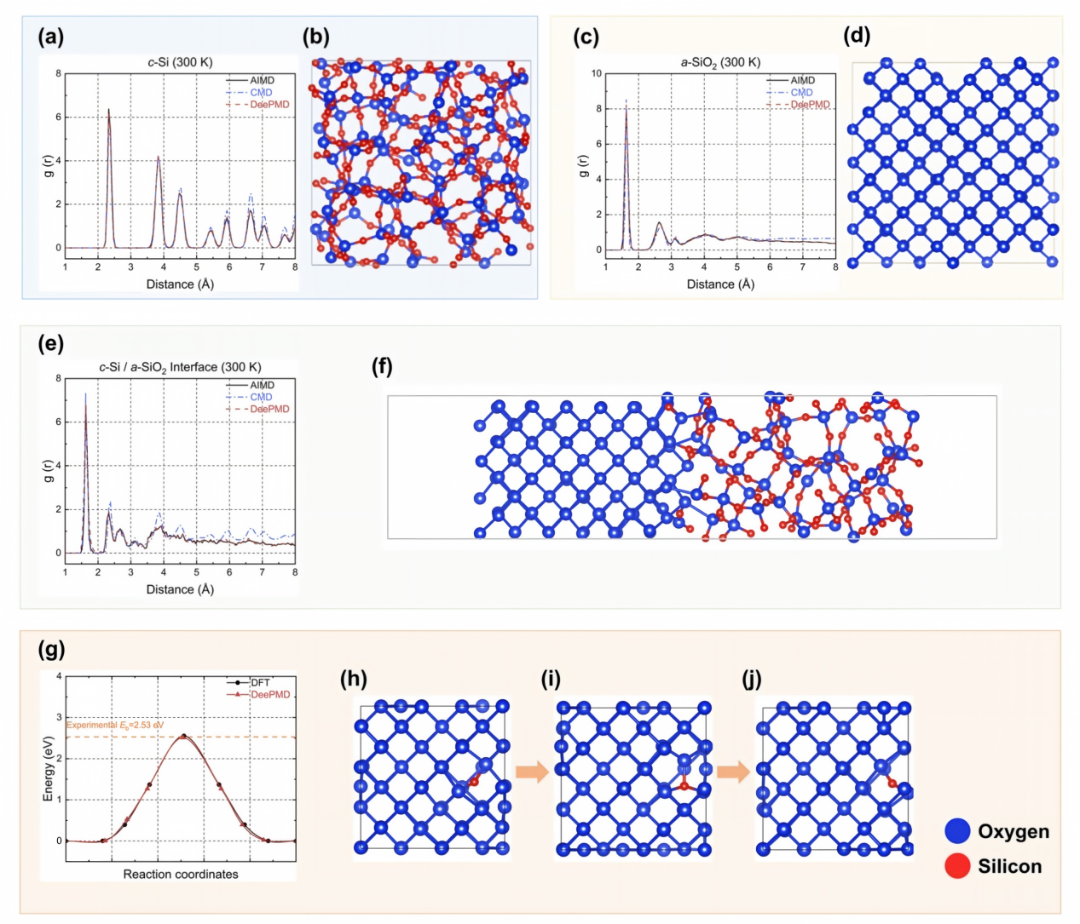
Fig. 1 Accuracy analysis of structural and dynamical properties for DP model. The comparison of radial distribution functions (RDFs) for (a) crystal Si (c-Si), (c) amorphous SiO₂ (a-SiO₂) and (e) a-SiO₂/c-Si interface system calculated by AIMD, CMD, and DeePMD. The calculated structure for (b) a-SiO₂, (d) c-Si and (f) a-SiO₂/c-Si interface system. (g) Nudged elastic band (NEB) analysis of oxygen diffusion pathways in silicon: DFT vs. DeePMD minimum energy pathways (MEP) and the yellow line indicates the experimental value of migration barrier (Eb). Atomic configurations along diffusion trajectory: (h) initial state, (i) transition state, (j) final stabilized state.
Furthermore, the study employed the DP model to perform nudged elastic band (NEB) calculations to evaluate the migration barrier of oxygen atoms in silicon. Results show that the DP-predicted barrier is 2.51 eV, in excellent agreement with the DFT-calculated 2.55 eV and the experimentally reported 2.53 eV; the maximum relative error in energy along the minimum energy path is less than 0.13 eV. More critically, the DP-NEB calculation achieved a four-order-of-magnitude speedup compared to traditional DFT-NEB, enabling simulations of industrially relevant systems requiring repeated evaluation of the energy landscape, such as multi-step implant-anneal cycles.
DFT-MD+DP Framework: Accurate Prediction of Oxygen Distribution and Layer Thickness
After validating the accuracy of the DP model, the research team integrated it into a complete computational workflow: first, DFT-MD was used to simulate the high-energy oxygen ion implantation process; then, the trained DP model was utilized for long-time annealing diffusion simulations (i.e., the DFT-MD+DP method). The depth profiles of oxygen concentration predicted by this method were compared with experimental secondary ion mass spectrometry (SIMS) data. Under multiple annealing temperatures from 1073 K to 1573 K, the normalized root-mean-square errors were all below 0.12 (see Fig. 2a–3d).
To quantitatively define the boundary between the SOI and BOX layers, the study adopted the characteristic oxygen enrichment in the 40–70 nm depth range from the experimental SIMS profiles and defined 2 × 10²² atoms/cm³ as the critical oxygen concentration threshold for distinguishing SiO₂ from Si phases (see Fig. 2f). Applying this threshold, the DFT-MD+DP method successfully predicted the SOI/BOX layer thicknesses for 8 samples fabricated with different process parameters (implantation energy 143–175 keV, dose 6.00×10¹⁷–1.66×10¹⁸ ions/cm²). Comparison results show that the average deviation between predicted and transmission electron microscopy (TEM) measured thicknesses for all samples is 4.7% (RMSE 11.59 nm). Taking Sample 5 as an example, the experimentally measured SOI/BOX thicknesses were 169.0 nm/357.7 nm, while the simulation predicted 182.5 nm/349.6 nm, with errors within 5% (see Fig. 4e, 4m). (see Fig. 3)
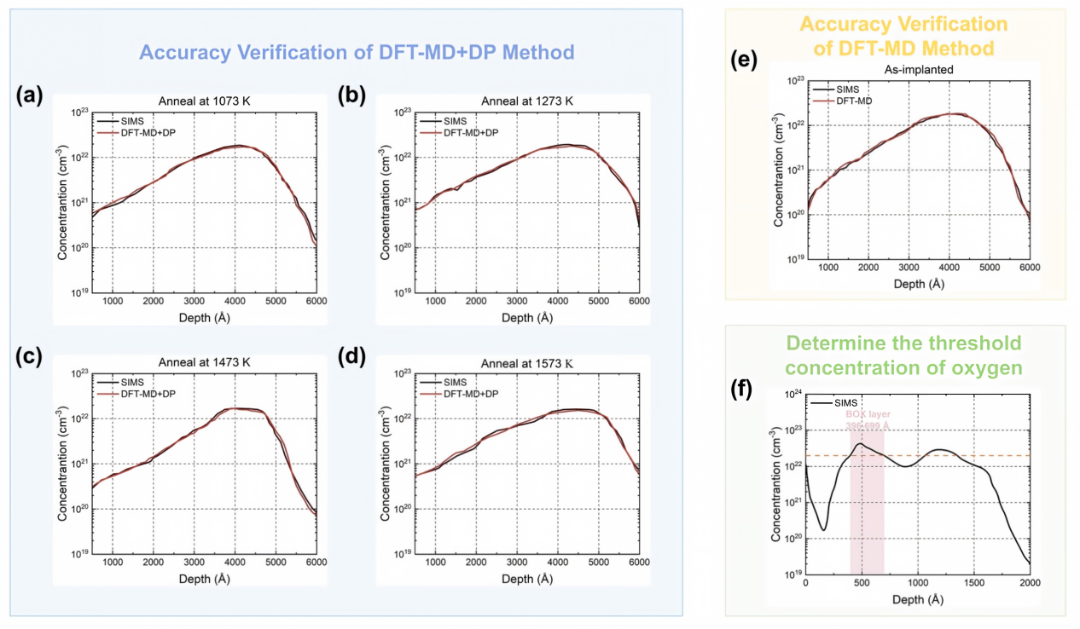
Fig. 2 Validation of the accuracy of computational framework and determination on the interfacial threshold. Temperature-dependent validation of DFTMD + DP method for oxygen concentration prediction during post-implantation annealing: a 1073 K, b 1273 K, c 1473 K, d 1573 K thermal conditions. e Assessment.
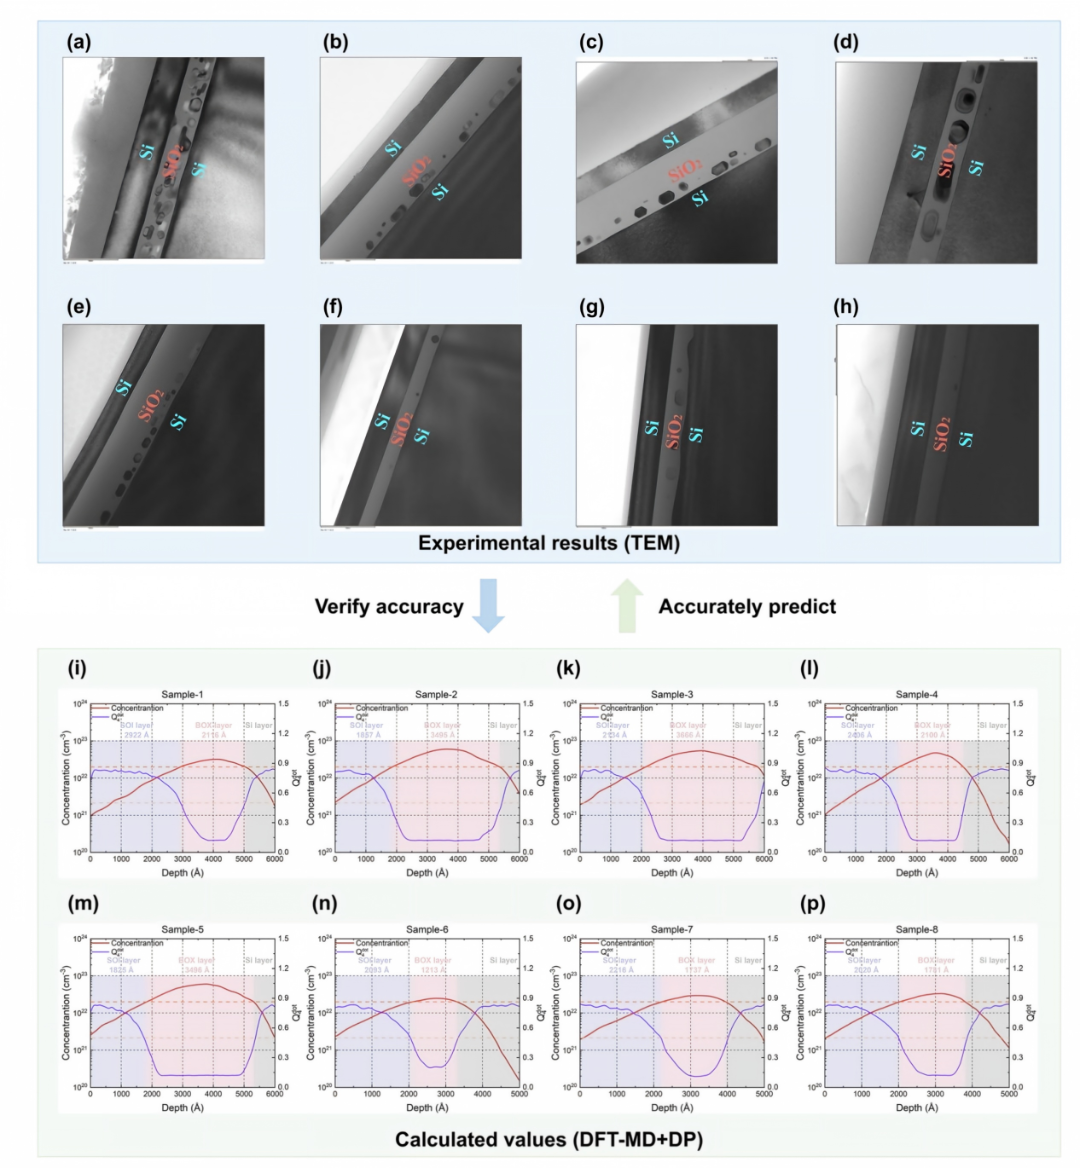
Fig. 3 Cross-validation of experimental characterization and prediction framework. a–h Cross-sectional TEM micrographs of implanted samples 1–8 (scale bar: 500 nm). i–p Depth-resolved oxygen concentration and Q₄dot profiles from DFT-MD + DP simulations of implantation-annealing cycles. Predicting interface thickness of SOI and BOX layers through synergistic analysis of oxygen concentration calculated by DFT-MD + DP method and experimental thresholds.
Additionally, the study introduced the bond-orientational order parameter q₄dot to assist in defining the interface from a structural disorder perspective. Results indicate that the oxygen concentration threshold of 2 × 10²² atoms/cm³ corresponds exactly to the steep drop in q₄dot, which is physically consistent with the interface contrast observed in TEM.
Beyond Classical Potentials: Accurately Quantifying c-Si/a-SiO₂ Interfacial Thermal Resistance
Beyond oxygen diffusion behavior, the DP model was also used to calculate the critical c-Si/a-SiO₂ interfacial thermal resistance (ITR, i.e., Kapitza resistance) in the SOI structure. Through non-equilibrium molecular dynamics (NEMD) simulations, the DP model yielded an ITR value of 0.83 × 10⁻⁸ m²/W. Compared with literature values: CMD calculation based on the Tersoff potential gives 0.43 × 10⁻⁸ m²/W, DFT calculation gives 0.69 × 10⁻⁸ m²/W, and experimental measurement is 2.13 × 10⁻⁸ m²/W. The DP model’s result is significantly better than CMD and DFT, and closer to the experimental benchmark. The paper notes that the current model is based on an ideal interface (perfectly connected bulk materials), whereas real SIMOX process interfaces feature roughness, silicon precipitates, and non-stoichiometric transition regions. These non-ideal factors introduce additional phonon scattering, leading to higher measured ITR. This points the direction for future extension of the DP model to thermal transport simulations at more realistic complex interfaces.
Summary
This case demonstrates the deployment pathway of DFT-MD + DP multiscale simulation centered on a deep learning potential in the SOI/BOX scenario: within a single potential function and a unified workflow, it reproduces the implantation and annealing diffusion behavior of oxygen in silicon and quantitatively provides layer thicknesses, and evaluates the ITR of the c-Si/a-SiO₂ interface via non-equilibrium thermal transport calculations, showing good agreement with SIMS/TEM and experimental thermal benchmarks. This workflow provides a traceable and scalable computational toolchain for SIMOX process parameter optimization and device-level thermal management, and can be further extended to coupled modeling of more complex interfaces and longer time scales.