What Can DP Do too? | Unraveling the Mystery of Water's 'Second Critical Point'
Water, one of the most common yet complex molecules, has long perplexed researchers with its thermodynamic properties. A controversial hypothesis suggests that under supercooled conditions, water may exhibit a "liquid-liquid transition (LLT)"—a transformation between low-density liquid (LDL) and high-density liquid (HDL)—governed by a "second critical point (LLCP)."
However, direct observation of the LLCP has been extremely challenging. Within experimentally accessible temperature-pressure ranges, liquid water readily freezes into ice, while simulations struggle to reach the microsecond timescale. As a result, this hypothesis has long remained an unresolved "mystery".
Recently, F. Sciortino et al. leveraged the DeePMD framework with the DNN@MB-pol potential model to conduct microsecond-scale molecular dynamics simulations, achieving high precision approaching CCSD(T) calculations. For the first time, they provided strong constraints on the location of the liquid-liquid phase transition critical point in water. Published in Nature Physics under the title "Constraints on the location of the liquid-liquid critical point in water," this work opens a new chapter in understanding water's anomalous behavior.
From MB-pol to DNN@MB-pol: Balancing Precision and Efficiency
The most reliable approach for high-precision simulations of water's microscopic behavior remains quantum chemistry-based potential energy surface modeling. MB-pol, a many-body interaction water potential model proposed in recent years, uses CCSD(T)-calculated two-body and three-body potential terms to achieve excellent fitting across all temperature-pressure conditions.
However, precision comes at a cost. Simulating thousands of molecules over microsecond timescales is nearly unfeasible with MB-pol. To address this, the researchers introduced the DNN@MB-pol potential function within the DeePMD framework. Trained on MB-pol data, this deep neural network potential retains high precision while improving computational efficiency to acceptable levels.
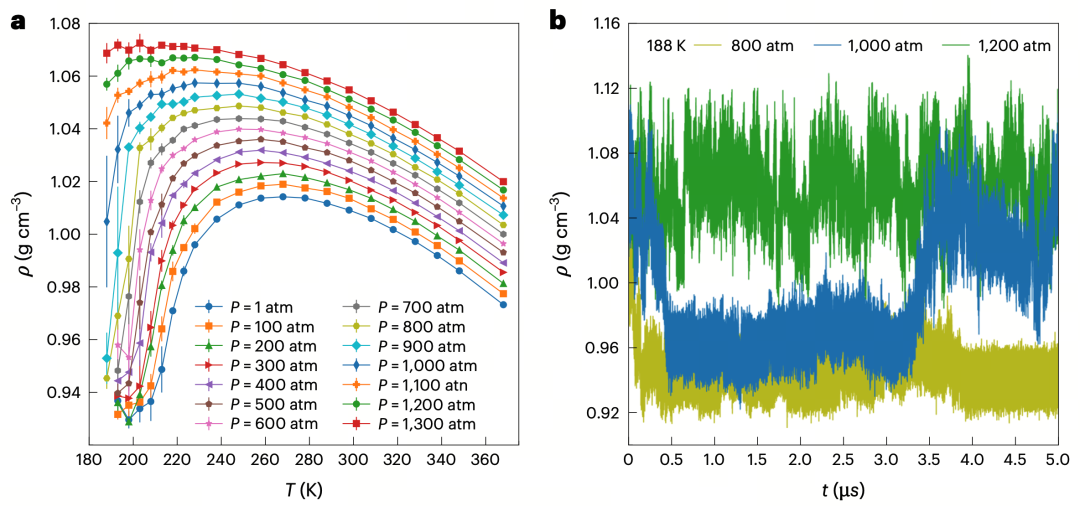
Figure1a: Water density curves simulated by DNN@MB-pol under different temperatures and pressures, showing abnormal density increase at low temperatures;
Figure1b: Time evolution of water density at 188 K under varying pressures, with density fluctuating between two values near 1000 atm, suggesting switching between two liquid structures at the phase transition boundary
Breakthrough in Long-Time-Scale Simulations
Using DNN@MB-pol, the study performed 8-microsecond molecular dynamics simulations on 512 water molecules across temperature ranges from 180 K to 220 K, directly observing the dynamics of liquid-liquid phase transitions at the microscale for the first time. Simulations showed clear transitions from a single liquid phase to a two-phase coexistence state under specific temperature-pressure conditions, providing direct evidence for the LLCP and validating numerous indirect inferences.
Furthermore, the authors constructed free energy landscapes of supercooled water at different state points using the weighted histogram analysis method (WHAM). This method estimates the density of states at different volumes and energies from limited simulation trajectories, deriving the trend of Gibbs free energy with density.
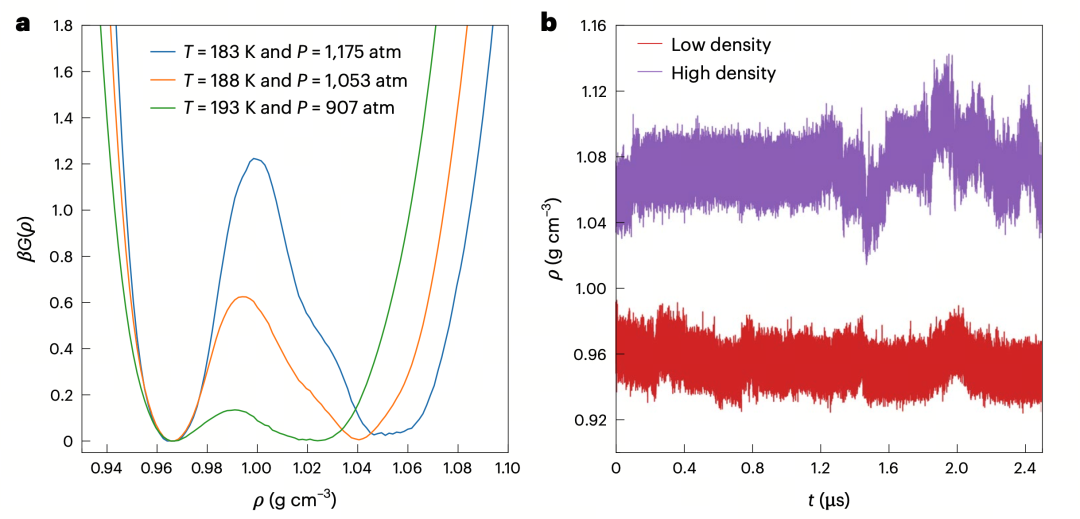
Figure2a: Free energy profiles at three temperature-pressure conditions near the critical point, all exhibiting a typical double-well structure indicating two stable liquid phases (LDL and HDL), with barrier height increasing as temperature decreases; Figure2b: At 178 K and 1270 atm, two independent trajectories starting from low-density (red) and high-density (purple) initial states maintained their respective densities over time, further confirming the kinetic distinguishability of the two liquid phases
Redrawing Water's Phase Diagram
To comprehensively characterize the thermodynamic behavior of water in the supercooled region, the authors compiled and plotted a phase diagram based on DNN@MB-pol simulations (Figure 3). It marks critical boundaries such as the liquid-liquid coexistence line, critical point, spinodal lines (indicating phase stability limits), Widom line (denoting the locus of maximum thermodynamic fluctuations), and the temperature of maximum density (TMD) line.
The coexistence line near the LLCP exhibits a negative slope, indicating that the LDL phase has lower entropy (more ordered), while the HDL phase, though denser, is more "disordered"—consistent with compressibility calculations. Comparing simulation results with experimental phase diagrams, DNN@MB-pol shows high overall consistency, despite a ~10 K temperature offset attributed to minor differences between the MB-pol training data and real systems, which does not affect its ability to reconstruct the physical landscape.
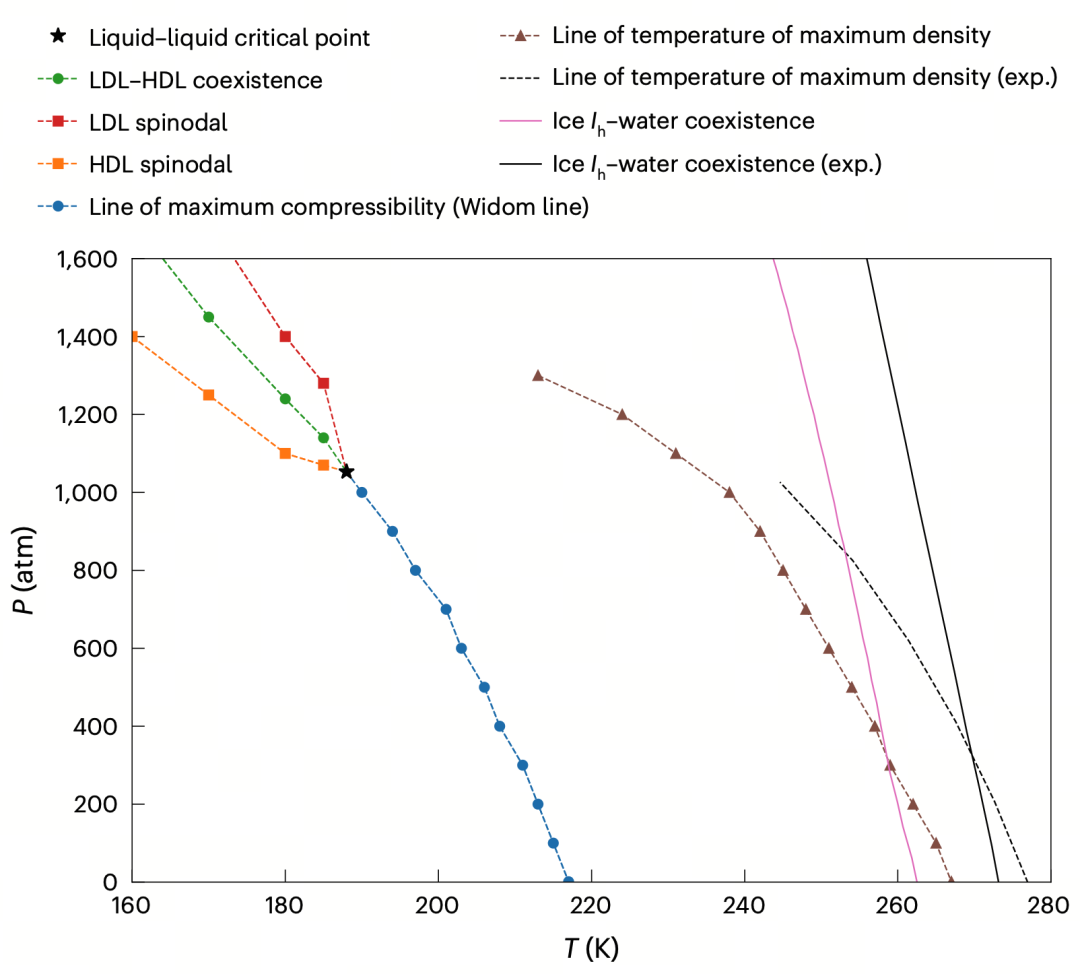
Figure3: Phase diagram of supercooled water. Data points from NPT ensemble simulations using the DNN@MB-pol potential model, showing liquid-liquid coexistence line, critical point, spinodal lines, Widom line, TMD line, and comparison between simulations and experiments
Conclusion: From "Hypothesis" to "Empirical Evidence"
This work not only provides the strongest support yet for the liquid-liquid phase transition hypothesis but also highlights the critical role of the DeePMD framework in frontier science. The DNN@MB-pol model extends high-precision simulations from tiny scales and picosecond timescales to hundreds of molecules and microseconds, pushing the boundaries of theoretical modeling.
From classical force fields to quantum precision, and from picoseconds to microseconds, DeePMD transforms "theoretical speculation" into "repeatable observation." It offers a new perspective on water's anomalies and paves the way for studying micro-mechanisms in complex systems. In the future, we may see DeePMD applied to more material systems where direct experimental verification is impossible.