What Can DP Do Too? Atomic-Scale Dislocation Nucleation in AgPd Nanoalloys via Deep Learning Potential
Core–shell nanostructured alloys, with their tunable electronic structures and catalytic performance, show broad application prospects in fields such as fuel cells and electrocatalysis. Among them, the Pd@Ag system, with a lattice mismatch of about 4%, serves as an ideal model for studying strain-driven structural transformations. However, traditional empirical potentials cannot accurately describe the complex atomic processes of dislocation nucleation, stacking fault evolution, and twin boundary formation in bimetallic systems, limiting an in-depth understanding of the octahedral-to-icosahedral structural transformation mechanism.
To address this challenge, Professor Chen Fuyi's group at Northwestern Polytechnical University published the study “Deep learning potential reveals surface dislocation nucleation in AgPd Nanoalloy during atomic rearrangement” in Computational Materials Science. They used a deep learning potential to perform systematic molecular dynamics simulations of the structural reconstruction of the Pd309@Ag1106 core–shell nanocluster at 500 K. The DP model was constructed via active learning using the DP-GEN workflow, with training data covering bulk, surface, and deformed configurations of pure Pd, pure Ag, and various Pd–Ag alloy phases (L10, L11, L12). The final model achieves a root-mean-square error of 4.11 meV/atom for energy and 17.8 meV/Å for forces on the validation set, in excellent agreement with DFT calculations (see Figure 1) and significantly better than traditional EAM potentials.
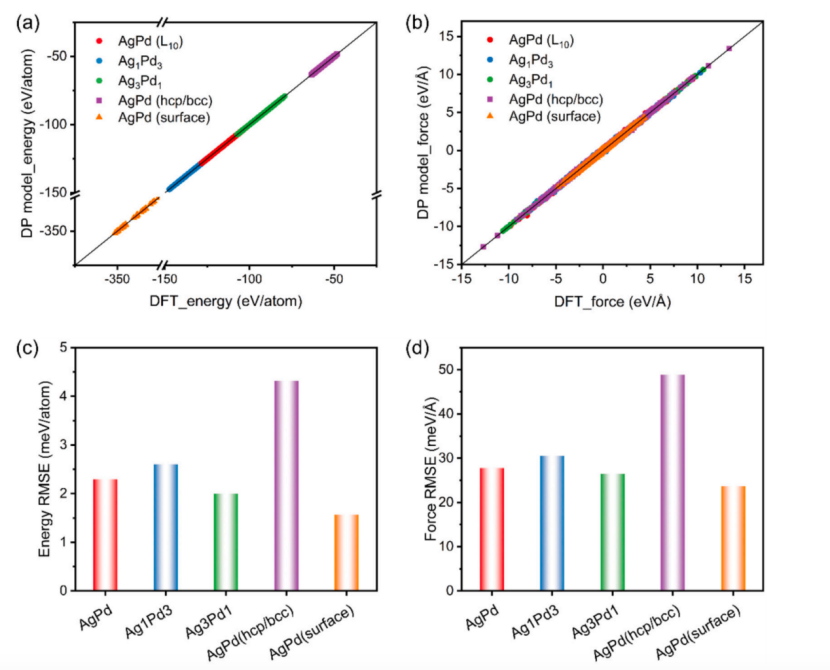
Figure 1. The training error of the DP of the AgPd in comparison to DFT. (a) and (b) Training error toward potential energy and forces on the validation datasets. (c) and (d) Root-mean-square-error (RMSE) of potential energy and forces on the validation datasets, including AgPd (L10), Ag1Pd3, Ag3Pd1, AgPd (hcp and bcc) phases, surface structures.
Physical property prediction and model validation
To evaluate the reliability of the DP model, the research team systematically calculated various physical properties of AgPd alloys in FCC and HCP structures. For the FCC structure, the DP-predicted lattice constant is 4.035 Å, deviating only 0.65% from the DFT value (4.009 Å); the prediction errors for elastic constants C11, C12, and C44 are all within 6%. In contrast, the EAM potential significantly overestimates C11 and C12 (see Table 1). For the HCP metastable phase, DP also shows better accuracy than EAM.
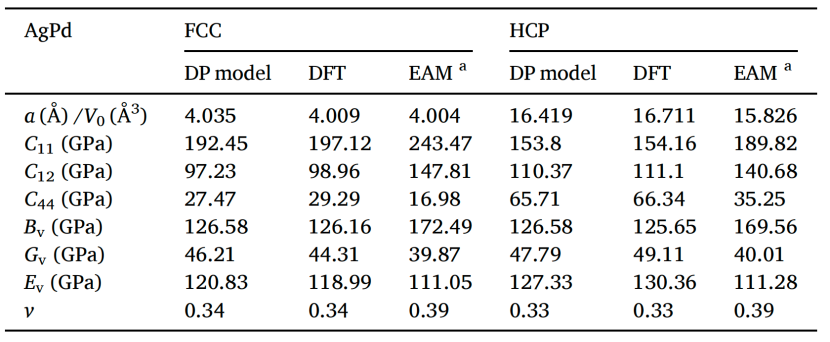
Table 1. Equilibrium properties as modeled by the deep potential (DP) of AgPd (L10): Lattice parameter a, equilibrium volume per atom V0, independent elastic constants C11, C12, and C44, bulk modulus Bv, shear modulus Gv, Young's modulus Ev, Poisson's ratio ν. Both FCC and HCP structures are considered.
The generalized stacking fault energy (GSFE) calculation results show that the stacking fault energy peak of the AgPd alloy is about 1.25 J/m², much higher than that of pure Ag (0.32 J/m²) and pure Pd (0.55 J/m²) (see Figure 2). This significant alloying effect reflects the complex electronic interactions between Ag and Pd, and also implies that dislocation slip in AgPd must overcome a higher energy barrier. Phonon spectrum calculations further validate the DP model's ability to describe lattice dynamics, showing excellent agreement with DFT results in the 0–6 THz range (see Figure 3).
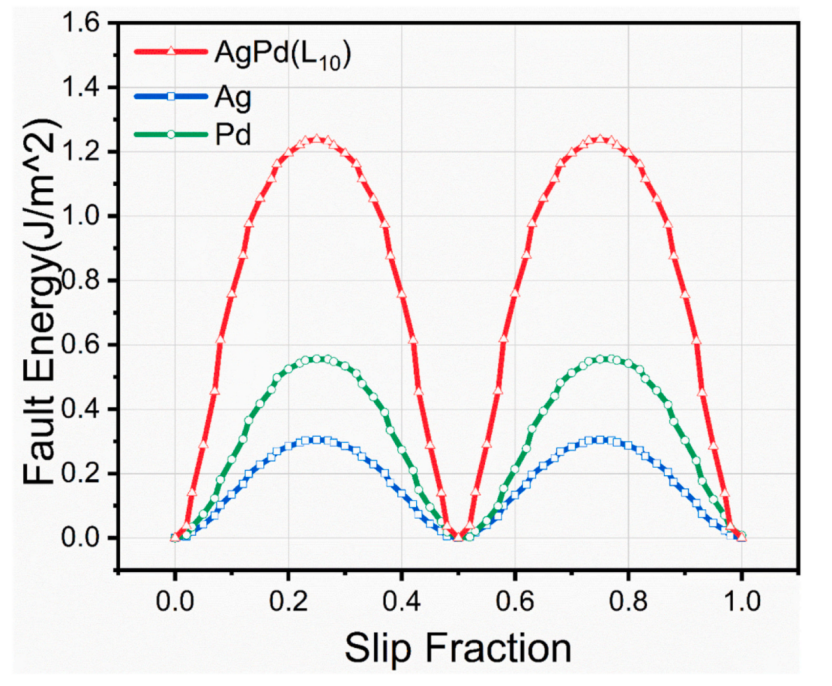
Figure 2. GSFE lines (− lines) along the (a) (110)/2 directions, as well as on the loosest packing {111} planes predicted by DP of Ag, Pd, and AgPd (L10).
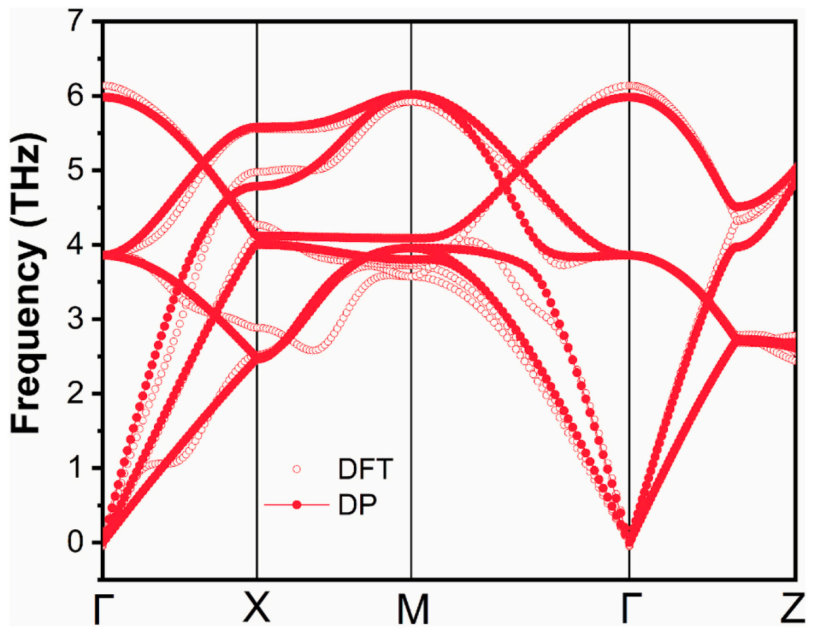
Figure 3 phonon spectra of AgPd (L10) alloy. The plot displays frequency (THz) on the vertical axis ranging from 0 to 7 THz versus high-symmetry points (Γ, X, M, Γ, Z) in the Brillouin zone on the horizontal axis. Two calculation methods are compared: DFT shown as open circles and DP shown as solid red lines. (For interpretation of the references to colour in this figure legend, the reader is referred to the web version of this article.)
Dislocation nucleation and evolution during the octahedral-to-icosahedral transformation
MD simulations of the Pd309@Ag1106 core–shell nanocluster at 500 K for 200 ps reveal a clear octahedral (Oh) to icosahedral (Ih) structural transformation. The initial octahedron exhibits a faceted morphology typical of FCC metals, while the final icosahedron displays five-fold symmetry (see Figure 4(a)). Cross-sectional analysis shows that, despite frequent dislocation activity, the integrity of the Pd core within the Ag shell is maintained throughout the transformation (Figure 4(b)). Common neighbor analysis (CNA) shows that the structure, initially dominated by FCC (green), gradually evolves into a complex configuration coexisting FCC and HCP (red), with HCP regions distributed along twin boundaries (Figure 4(c)). Some atoms at the core–shell interface exhibit icosahedral coordination (yellow), indicating that this region is a preferential site for dislocation nucleation.
Stress analysis reveals a significant internal stress redistribution process. In the initial octahedron, the stress distribution is relatively uniform (−8 to 8 GPa), whereas in the icosahedron, stress is highly concentrated (−40 to 12 GPa), especially at twin boundary intersections (Figure 4(d)). The von Mises stress (0–25 GPa) further indicates that the geometric frustration caused by twenty FCC tetrahedral regions converging at the center in the icosahedral structure is accommodated locally through the twin boundary network (Figure 4(e)). The shear strain distribution shows that strain propagates from the surface inward and concentrates along twin boundaries (Figure 4(f–g)).
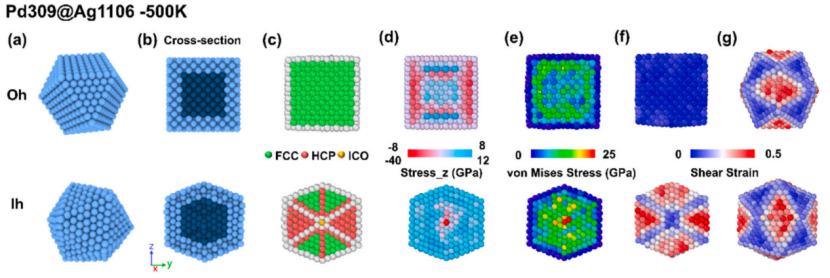
Figure 4 The Oh to Ih shape restructuring of Pd309@Ag1106 nanocluster at 500 K for 200 ps. (a) External morphology evolution showing the transition from faceted octahedral to five-fold symmetric icosahedral structure; (b) Cross-sectional view revealing the preservation of core-shell architecture throughout the transformation; (c) Structural analysis using common neighbor analysis: FCC (green), HCP (red), and icosahedral coordination (yellow); (d) Normal stress distribution along the zaxis showing significant redistribution from a relatively uniform state (− 8 to 8 GPa) in the Oh structure to highly heterogeneous stress states (− 40 to 12 GPa) in the Ih structure; (e) Von Mises stress distribution (0–25 GPa) highlighting regions of highest mechanical distortion at twin boundaries in the Ih structure; (f) Cross-sectional and (g) surface views of Von Mises shear strain distribution (0–0.5). (For interpretation of the references to colour in this figure legend, the reader is referred to the web version of this article.)
Quantitative analysis of the evolution of atomic coordination numbers with time (Figure 5(a)) shows that the transformation proceeds through distinct stages: 0–6 ps is an incubation period during which the number of FCC atoms remains essentially unchanged; from 6–10 ps, surface reconstruction begins and atoms with “other” coordination increase slowly; near 10 ps, BCC atoms begin to appear, marking the onset of the FCC→BCC→HCP transformation pathway; the number of BCC atoms peaks at about 200 at 15 ps and then drops rapidly, while HCP atoms increase rapidly from 13 ps and reach about 440 at 16 ps. Dislocation density analysis (Figure 5(b)) shows that Shockley partial dislocations begin to nucleate near 10 ps, with multiple density spikes between 12–15 ps (up to 8×10^10 cm⁻²); after 15 ps, the dislocation density drops to zero and the transformation is complete.
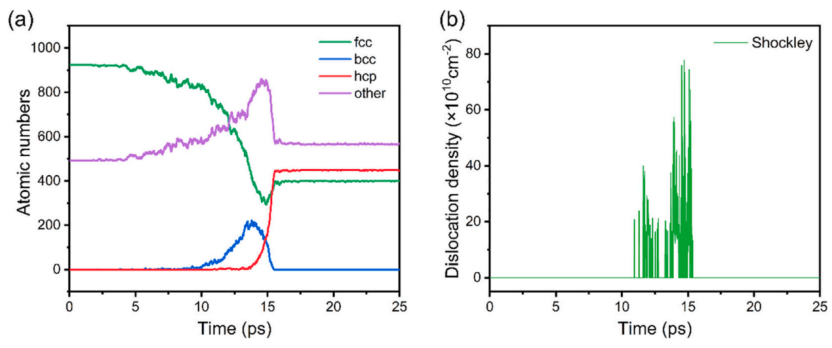
Figure 5 The Oh to Ih shape restructuring of Pd309@Ag1106 nanoalloys at 500 K for 200 ps. (a) The FCC, BCC, HCP, and other atomics numbers as a function of time during the deformation. (b) The evolution of dislocation density as a function during Oh-to-Ih transformation. The Shockley dislocation densities is indicated by green. (For interpretation of the references to colour in this figure legend, the reader is referred to the web version of this article.)
Dynamic evolution of dislocations and formation of twin boundaries
By tracking the evolution of dislocation structures from 10.9 to 14.8 ps (see Figure 6), the process of surface dislocation nucleation can be clearly observed. Shockley partial dislocations (green lines) first appear in high-surface-energy regions such as octahedral vertices and edges (11.6 ps), and then propagate inward along {111} planes (13.9–14.1 ps). The Burgers vectors (red arrows) are consistently along the <112> direction, indicating a crystallographic preference of the slip system.
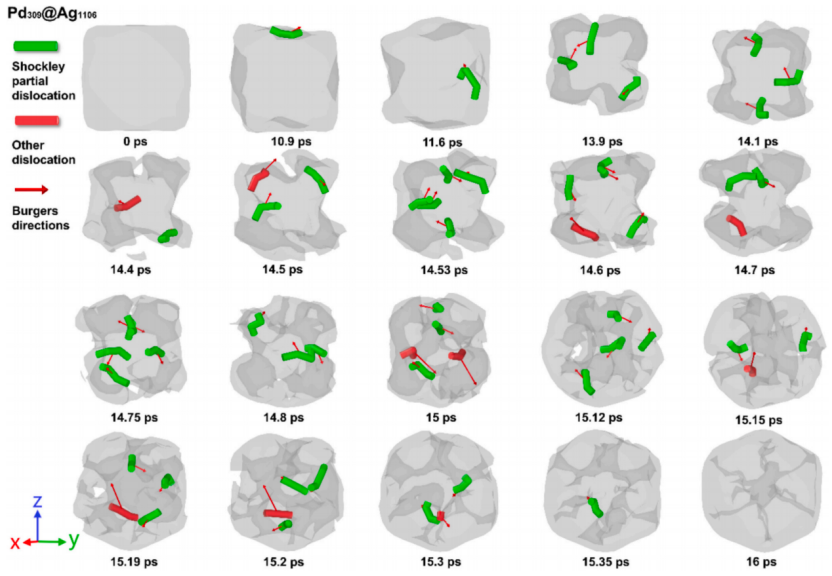
Figure 6 Time evolution of structural defects in Pd309@Ag1106 nanocluster during Oh-to-Ih transformation at 500 K, from 0 ps to 16 ps. Shockley partial dislocations (green lines) and other dislocations (red lines) are identified. Red arrows indicate Burgers vectors directions. (For interpretation of the references to colour in this figure legend, the reader is referred to the web version of this article.)
Figure 7 shows the complete evolution sequence of CNA coordination environments from 0 to 25 ps. Before 10 ps, the system is dominated by FCC (green) coordination, with only a few BCC (blue) atoms appearing sporadically on the surface. As the transformation enters the active period (10–16 ps), the number of BCC atoms increases significantly and they are gradually replaced by HCP (red) coordination, ultimately forming a twin boundary network marked by HCP in the icosahedral structure. Notably, some atoms near the core–shell interface exhibit icosahedral coordination (yellow), and these regions coincide highly with dislocation nucleation sites.
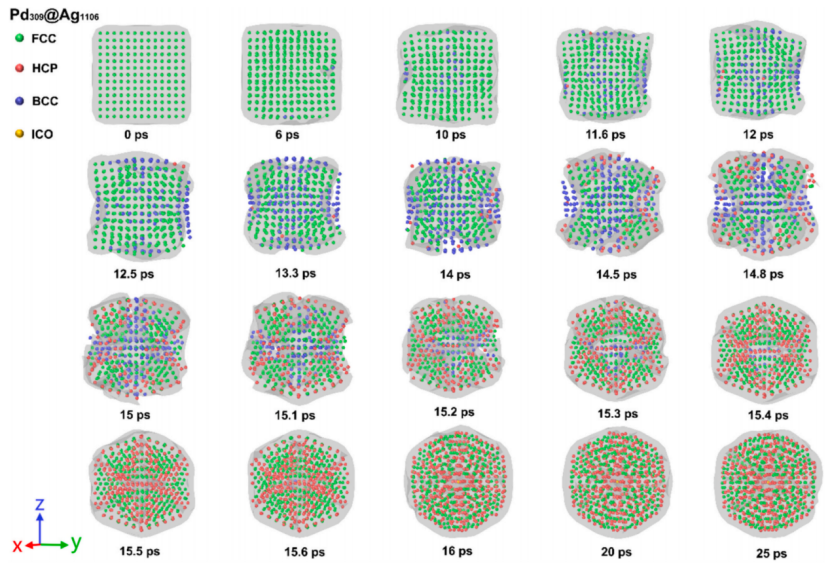
Figure 7 Time evolution of structural defects in Pd309@Ag1106 nanocluster during Oh-to-Ih transformation at 500 K, from 0 ps to 25 ps. FCC (green), HCP (red), BCC (blue), and ICO (yellow). (For interpretation of the references to colour in this figure legend, the reader is referred to the web version of this article.)
Notably, these dislocations do not evolve into stable dislocation loops as in conventional plastic deformation. Near 14.4 ps, non-Shockley dislocations (red lines) appear at stacking fault intersections or at the core–shell interface; by 15.36 ps, the vast majority of dislocations have transformed into a twin boundary network with HCP coordination, and the dislocation line density decreases significantly (see Figure 8(f–h)). This unique “dislocation → twin boundary” evolution pathway is characteristic of systems with moderate lattice mismatch (4.9%): the driving force provided by the mismatch is sufficient to trigger dislocation nucleation but not strong enough to sustain a stable dislocation network, so the system instead achieves energy minimization through twin boundaries.
Figure 8 shows the spatiotemporal correlation between von Mises stress and defect structures. At 10.9 ps, stress concentration first appears at vertices and edges (3–7 GPa, Figure 8(a)), corresponding to the appearance of scattered BCC atoms in Figure 7. When the local von Mises stress reaches a critical threshold of 10–15 GPa (white box region in Figure 8(b)), Shockley partial dislocations begin to nucleate. As stress further concentrates during 15.0–15.36 ps, dislocations gradually transform into twin boundaries (Figure 8(g)), and stress is redistributed to twin boundary intersections (Figure 8(c–d)).
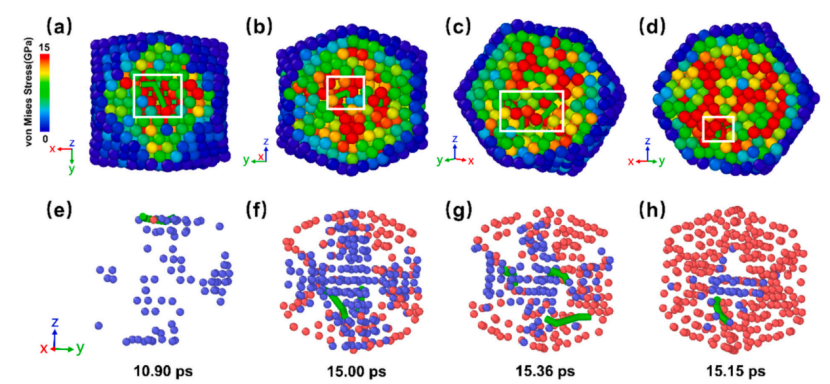
Figure 8 Time evolution of structural defects and stress distribution in Pd309@Ag1106 nanocluster during Oh-to-Ih transformation at 500 K. (a-d) Cross-sectional views of von Mises stress distribution at 10.9, 15.0, 15.36, and 15.15 ps, respectively, showing the evolution of stress concentrations during Shockley partial dislocation activity. The colour scale represents stress magnitude from 0 GPa (blue) to 15 GPa (red). White boxes highlight regions containing Shockley partial dislocations. (e-h) Corresponding three-dimensional views of structural defects from 10.90 ps to 15.15 ps. Non-FCC atoms are colored by their local atomic environments: HCP (red) and BCC (blue), while FCC atoms are shown in blue. Shockley partial dislocations are displayed as green lines. (For interpretation of the references to colour in this figure legend, the reader is referred to the web version of this article.)
Stress evolution and chemical ordering analysis
The evolution of the individual components of the stress tensor further reveals the mechanical pathway of the transformation. The z-direction stress (Figure 9) gradually expands from the initial −8 to 8 GPa to −20 to 14 GPa, and extreme compression of −40 GPa appears in the central region at 17.8 ps. The x- and y-direction stresses (supplementary material) exhibit similar magnitudes, indicating that the center of the icosahedron is in a near-hydrostatic compressive state. The von Mises stress (Figure 10) forms a star-shaped concentration pattern aligned with the five-fold symmetry during the peak transformation period (13.75–15.34 ps), with stress peaks up to 25 GPa. The shear strain (Figure 11) exhibits a characteristic X-shaped distribution at 13 ps, indicating the activation of the {111}<112> slip system, and after 16 ps it evolves into a stable pattern corresponding to the twin boundary architecture.
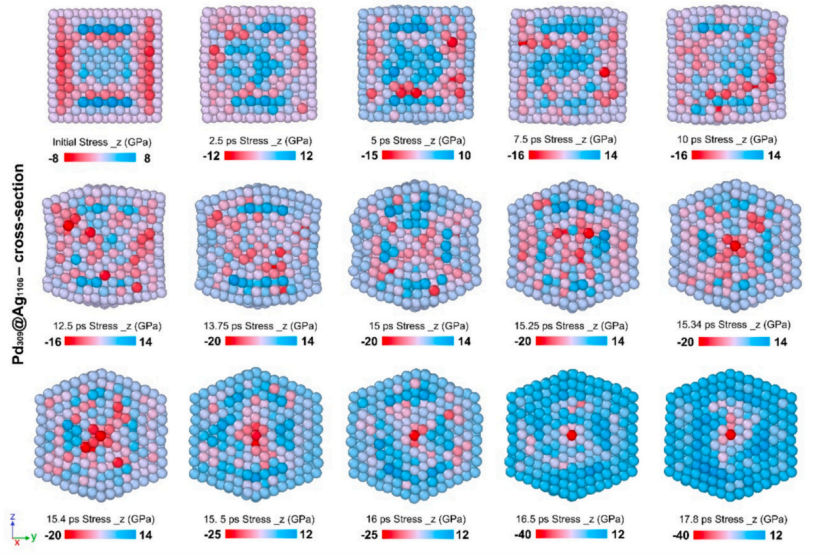
Figure 9 Evolution of atomic stress distribution of z-directions in cross-sectional views during Oh-to-Ih structural transformation of Pd309@Ag1106 nanocluster at 500 K. The colour scale represents stress magnitude ranging from compression (red) to tension (blue), with values indicated in GPa for each snapshot from 0 to 17.8 ps. (For interpretation of the references to colour in this figure legend, the reader is referred to the web version of this article.)
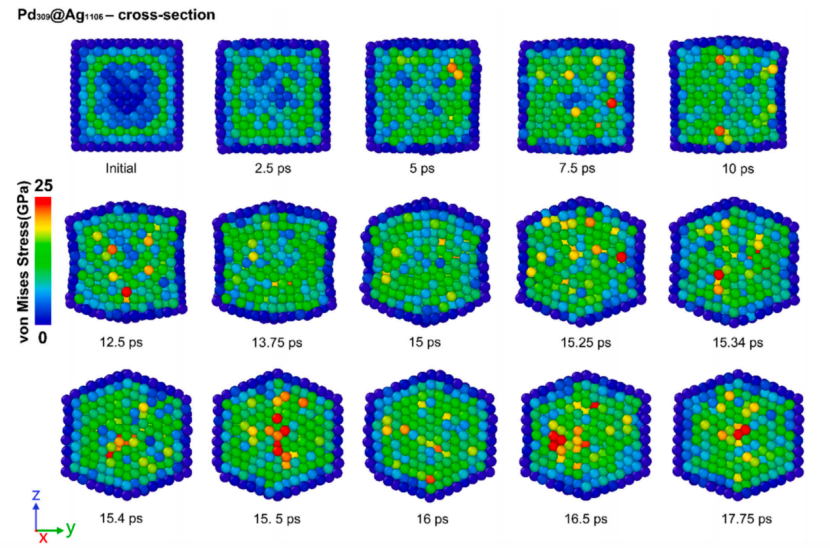
Figure 10 Cross-sectional snapshots of von Mises stress distribution during the Oh-to-Ih structural transformation of Pd309@Ag1106 nanocluster at 500 K. The colour scale represents stress magnitude from 0 GPa (blue) to 25 GPa (red), showing the evolution of local stress concentrations from 0 to 17.75 ps. (For interpretation of the references to colour in this figure legend, the reader is referred to the web version of this article.)
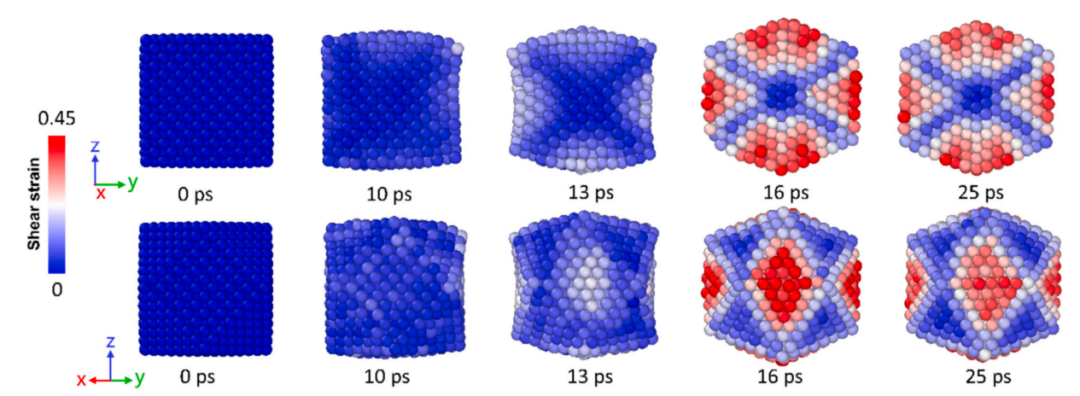
Figure 11 Evolution of shear strain distribution during the Oh-to-Ih structural transformation of Pd309@Ag1106 nanocluster at 500 K from 0 to 25 ps. The top row displays cross-sectional views along the y-z plane, while the bottom row shows corresponding views from an alternative perspective. The colour scale represents strain magnitude from 0 (blue) to 0.45 (red). (For interpretation of the references to colour in this figure legend, the reader is referred to the web version of this article.)
Analysis of the Warren–Cowley parameter (WCP) in the core–shell interface region (Figure 12) shows that the structural transformation is accompanied by an increase in chemical ordering. At the initial moment, the Pd-Pd WCP is −0.308 (weak clustering), and the Ag-Ag WCP is −0.020 (near random); by 16 ps, Pd-Pd decreases to −0.582 (enhanced clustering), Ag-Ag decreases to −0.149 (enhanced Ag segregation), and the cross parameter Pd-Ag increases from 0.198 to 0.374. The period of most dramatic WCP change (10–16 ps) precisely corresponds to the peak of dislocation activity, indicating that mechanically driven atomic rearrangement and chemical segregation are coupled processes.
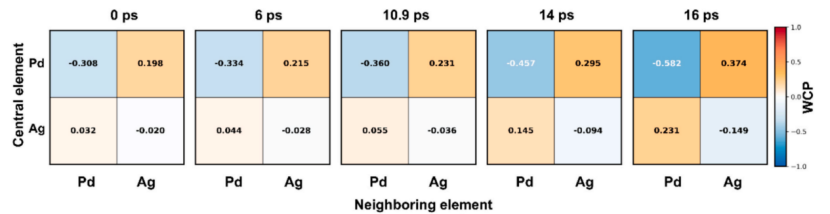
Figure 12 Warren-Cowley parameter (WCP) matrices showing the temporal evolution of atomic ordering in the Pd309@Ag1106 core-shell nanocluster interface region from 0 to 16 ps. Each 2 × 2 matrix represents the short-range order parameters between central atoms (rows) and their neighboring atoms (columns). The colour scale ranges from − 1.0 (strong segregation, represented by blue) to 1.0 (strong mixing, represented by red), with white indicating a random distribution. Negative WCP values indicate preference for like-atom clustering, while positive values suggest heteroatomic association. (For interpretation of the references to colour in this figure legend, the reader is referred to the web version of this article.)
Atomic displacement vector analysis (Figure 13) reveals the collective nature of the coordinated motion. At the initial moment, displacement vectors are random and small (thermal vibrations); at 10 ps, systematic outward displacements from face centers appear; at 13 ps, the displacement field exhibits highly ordered convergent flow toward the icosahedral vertices; at 16 ps, the displacement magnitude reaches about 5 Å, and the vector field shows five-fold symmetry; at 25 ps, the displacement magnitude decreases but residuals remain, concentrated at twin boundary intersections.
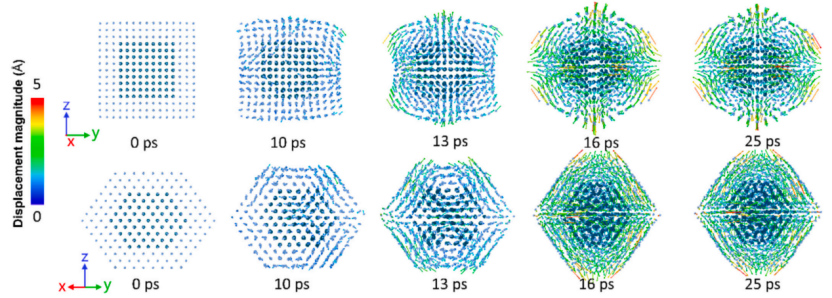
Figure 13 Evolution of atomic displacement vectors during the Oh-to-Ih structural transformation of Pd309@Ag1106 nanocluster at 500 K from 0 to 25 ps. The colour scale represents displacement magnitude from 0 Å (blue) to 5 Å (red), with vector arrows indicating displacement direction. (For interpretation of the references to colour in this figure legend, the reader is referred to the web version of this article.)
Summary
This study used a high-precision Deep Potential model to reveal the complete atomic mechanism of the octahedral-to-icosahedral transformation of the Pd309@Ag1106 core–shell nanocluster at 500 K: (1) the 4.9% lattice mismatch accumulates strain, and when a critical stress threshold of 10–15 GPa is reached at the surface, Shockley partial dislocation nucleation is induced; (2) after propagating along {111} planes, dislocations evolve into twin boundaries rather than conventional stable dislocation loops; (3) extreme stress concentrations of about −45 GPa form at twin boundary intersections to accommodate the inherent geometric frustration of the icosahedron. This FCC→BCC→HCP coordination transformation pathway and the dislocation → twin boundary evolution mode provide an atomic-scale theoretical basis for understanding strain-driven structural reconstruction in bimetallic nanoalloys. All simulations above were performed based on the DP model, and the computational resources were provided by the State Key Laboratory of Solidification Processing at Northwestern Polytechnical University.