What Can DP Do Too? Deep Potential Reveals Surface-Hydroxyl-Structure-Dependent Water Dissociation Mechanism in Bipolar Membranes
Under reverse bias, bipolar membranes must continuously dissociate water into H⁺ and OH⁻ at the interface. Hydroxyl groups on the catalyst surface can accept or release protons, and terminal hydroxyls, bridging hydroxyls, and hydroxyls near different oxygen vacancies differ in their local structures and in how water molecules approach them. Identifying the specific sites that promote water dissociation is essential for linking surface-structure regulation to membrane voltage.
A team led by Professor Yuhang Wang at Soochow University, together with Professor Pengfei Ou’s group at the National University of Singapore and collaborators at the University of Sydney, published a research paper in Nature Communications titled “Bipolar membranes reveal surface-hydroxyl-structure-dependent water dissociation mechanism.” The authors selected SnO₂ quantum wires as a model catalyst and combined characterization, membrane and electrolyzer testing, Deep Potential molecular dynamics, and constrained ab initio molecular dynamics to compare the roles of different hydroxyls in acidic and alkaline pathways.
From Total Hydroxyl Content to Hydroxyl Location
The local environments near the cation-exchange layer and anion-exchange layer of a bipolar membrane are different, so water dissociation can proceed through protonation and deprotonation cycles at surface sites. The study therefore distinguishes terminal species on five-coordinate Sn from −OᵦᵣH associated with bridging oxygen vacancies and connecting neighboring Sn sites. Both types of sites contain hydrogen and oxygen, but their energy pathways for accepting a proton from water and then transferring it to surrounding water molecules are not necessarily the same.
The team prepared quantum wires with different reaction times and used electron paramagnetic resonance, Raman, and solid-state NMR to track oxygen vacancies and surface hydroxyls. QWs4 and QWs7 have similar total oxygen-vacancy concentrations, but the proportion of bridging oxygen vacancies increases with synthesis time; according to Raman analysis in the paper, the bridging oxygen-vacancy fraction increases from about 34% to 45%. With similar total defect densities but an increasing fraction of bridging sites, the enrichment of these sites becomes a key clue for explaining performance changes.
Different characterization methods also answer different questions: electron paramagnetic resonance helps compare defect-related signals, Raman distinguishes features of bridging and in-plane oxygen vacancies, and NMR indicates multiple hydroxyl environments on the surface. The proton NMR signal at about 6.2 ppm contains possible contributions from terminal hydroxyls, bridging hydroxyls, and adsorbed water; by combining Raman, NMR, and activity comparisons, the team identified changes in bridging sites associated with performance.
In pH 7|7 tests with pure water on both sides, the minimum transmembrane voltages of QWs4 and QWs7 at 1 A cm⁻² are 1.07 ± 0.02 V and 0.90 ± 0.03 V, respectively. After changing the pH of the electrolyte on both sides, the voltages also changed; pH 7|14 conditions are less favorable for the quantum wires examined. The authors therefore concluded that the step of transferring protons from water to the catalyst surface on the alkaline side may be the limiting step, and that atomic-scale models are needed to identify the sites responsible for this step.
This set of early comparisons was measured at room temperature with specific electrolyte combinations. The paper also found that catalyst loading and transmembrane voltage show a U-shaped or approximately U-shaped relationship, and interpreted this trend as a trade-off between catalytic and electric-field effects. Using the optimized loading for each sample, QWs7 shows a lower transmembrane voltage in this set of tests.
DP Molecular Dynamics Describes How SnO₂ Contacts Water
Atomic-scale calculations first require determining the dynamic contact structure between water and the partially hydroxylated SnO₂(110) surface. The paper uses the DeePMD-kit potential invoked in LAMMPS for molecular dynamics; the model uses DeepPot-SE as the structural descriptor basis, with data from the ElectroFace dataset for the SnO₂(110)/water interface. The training set contains 6000 structures, of which 600 were taken from initial ab initio trajectories and the rest were expanded by DP-GEN concurrent learning. After checking the model’s energies and atomic forces against reference data, it was used for 1 ns interface simulations at 330 K.
The interface model described in the methods section contains 669 atoms, with about 143 water molecules in the water layer. Using the trained DP potential, the team performed 1 ns dynamic simulations at this scale and reported the model’s energy and force errors relative to reference data. This trajectory provides an atomic-scale basis for observing the contact and evolution of water molecules with surface defects.
Machine-learning molecular dynamics provides dynamic contact structures between water molecules and surface sites. Supplementary Figure 4 of the original paper also shows the process in which water participates in the healing of bridging and in-plane oxygen vacancies, followed by the formation of surface hydroxyls. On this basis, the paper further uses enhanced sampling combined with Voronoi descriptors to characterize interfacial proton transfer. By taking the surface protonation state sp and the acid–base site distance sd as reaction coordinates, two-dimensional free-energy surfaces were constructed for the deprotonation processes of the two types of surface sites. The calculated deprotonation free energies for the two site types are 22.17 and 26.7 kJ/mol, corresponding to pKa values of 3.88 and 4.68, respectively.
Proton-Transfer Barriers at the Two Sites
In the SnO₂(110)/water model, the authors compare Sn₅c–H₂O⁺ on five-coordinate Sn with bridging −OᵦᵣH, and construct two-dimensional free-energy surfaces along the protonation state and the acid–base site distance (see Fig. 1). Under the acidic pathway defined in the paper, the deprotonated forms Sn₅c–OH and −Oᵦᵣ⁻ accept protons with almost no barrier; the reverse deprotonation of their products Sn₅c–H₂O⁺ and −OᵦᵣH has barriers of approximately 0.44 and 0.49 eV, respectively. These barriers obtained from constrained ab initio molecular dynamics provide a benchmark for comparing the roles of the two site types in different acid–base pathways.
The key difference appears in the alkaline pathway: the deprotonation of −OᵦᵣH to form −Oᵦᵣ⁻ has a barrier of about 0.03 eV, after which −Oᵦᵣ⁻ can accept a proton from water and release OH⁻. The paper’s calculations also compare other sites and indicate that reverse protonation of bridging oxygen sites is more favorable than the examined terminal site and another type of bridging protonation; the corresponding protonation of sites associated with in-plane oxygen vacancies requires a high barrier of about 2.2 eV. The differences in barriers among sites support the mechanistic claim that bridging hydroxyls promote the alkaline-side water dissociation cycle.
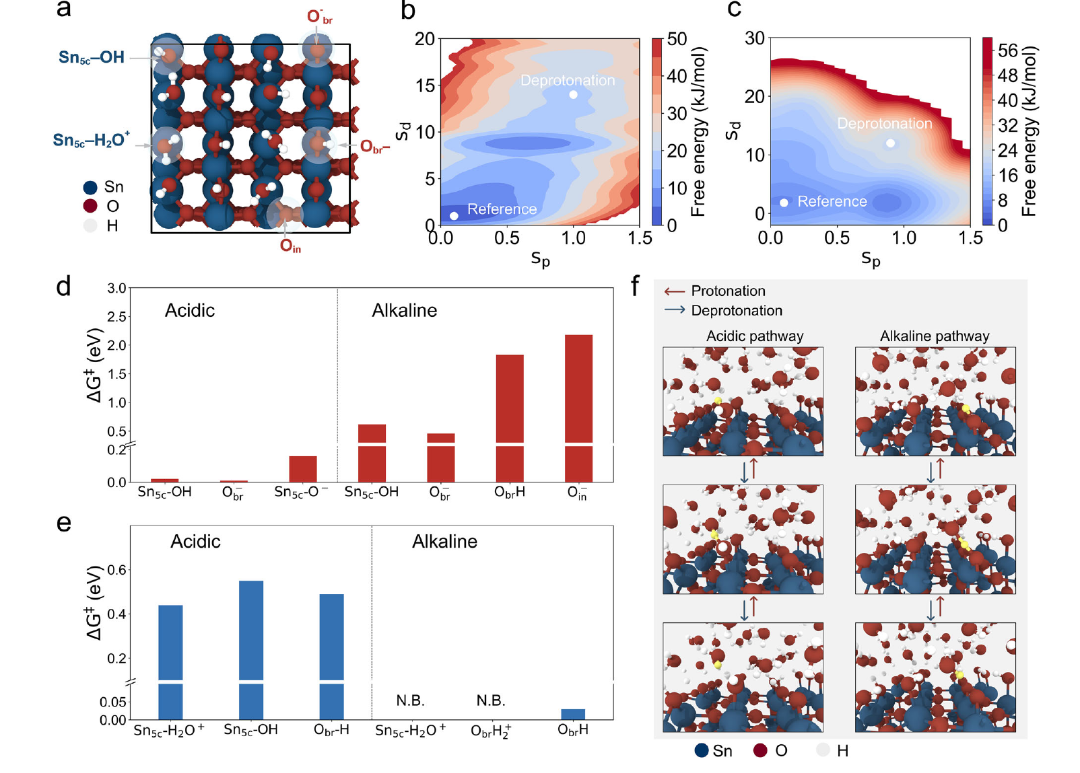
Fig. 1 Computational insights into hydroxyl-assisted water dissociation pathways. a The representative equilibrium configuration of the surface after MD simulations (water molecules omitted for clarity; detailed water adsorption structures are found in Supplementary Fig. 19). Free energy surfaces for deprotonation of (b) Sn₅c–H₂O⁺ and (c) −O_brH sites. s_p and s_d represent the protonation state and conjugate acid–base distance used as reaction coordinates for constructing the two-dimensional free-energy surfaces, respectively. The reference state corresponds to the partially hydroxylated surface in panel a. Energy barriers for (d) protonation and (e) deprotonation processes at two different sites, along with possible species. The proton source was used to classify the acidic and alkaline environments. N.B. denotes a barrierless process. f A schematic illustrating possible acidic and alkaline WD reaction pathways.
From Site Enrichment to Membrane and Electrolyzer Performance
Based on clues from characterization and calculations, the authors further extended the quantum-wire synthesis time to 10 hours. The bridging-site fraction of QWs10 increases to about 55%, and its transmembrane voltage decreases relative to previous samples at room temperature, pH 7|14, and a specific catalyst loading. In another pure-water electrolysis experiment at 60 °C, the QWs10 bipolar membrane shows a transmembrane voltage of 0.88 ± 0.02 V at 1 A cm⁻², corresponding to a full-cell voltage of 1.98 ± 0.02 V (see Fig. 2); it operates at the same current density for more than 550 hours.
Figure 2 also compares variables such as bridging hydroxyls, total oxygen vacancies, and specific surface area alongside transmembrane voltage. The correlations, together with constrained calculations, support the interpretation that bridging sites are more important, but membrane devices are simultaneously affected by loading, electric field, hydration, and mass transport, so not all voltage changes can be attributed to a single atomic site. The paper also clearly states that the calculated surface is an idealized model and does not fully reproduce the complex structure and operating electric field of a real catalyst layer.
The paper reports that QWs12 has a bridging-hydroxyl fraction and water dissociation performance close to those of QWs10, with a reported transmembrane voltage of about 0.89 V. Among the samples examined, the structural and performance gains from extending synthesis time plateau after QWs10; this also provides a basis for selecting quantum-wire preparation conditions.
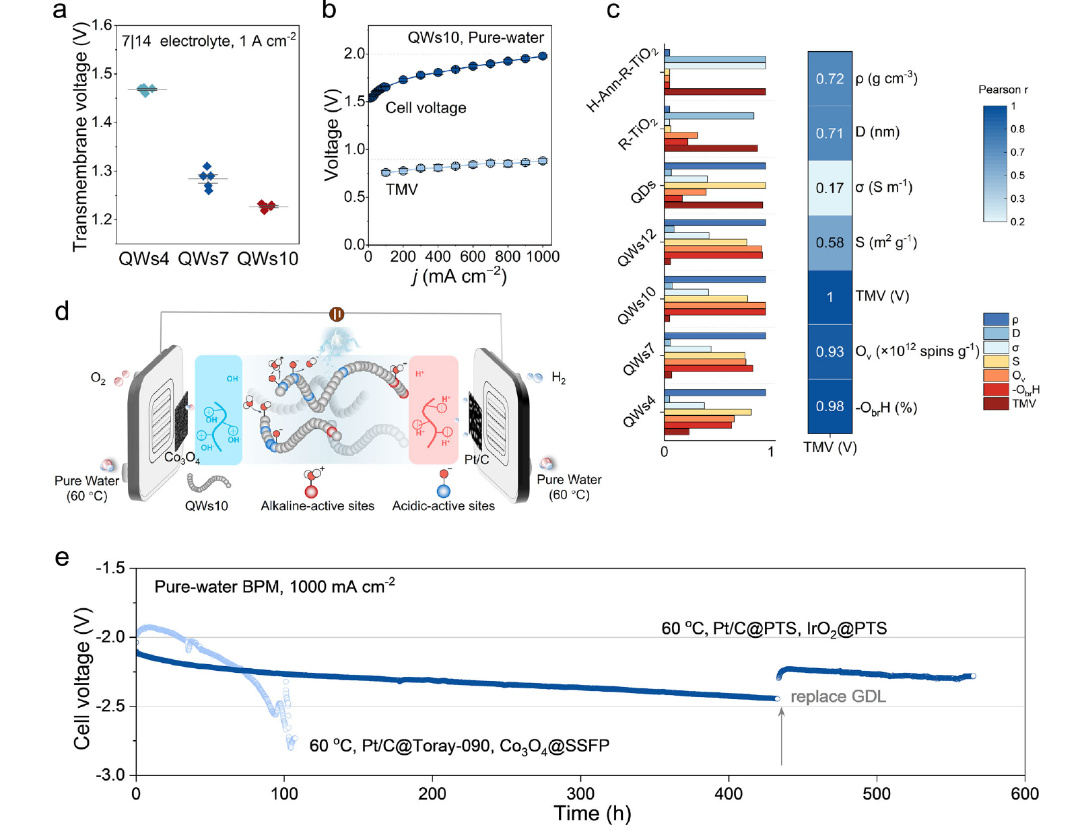
Fig. 2 Structure–activity relationship and device performance enabled by bridging hydroxyl motifs. a TMVs at 1 A cm⁻² for QWs4, QWs7, and QWs10 at the optimal mass loading of 19 μg cm⁻² under pH 7 | 14 electrolyte combinations. Measurements were conducted at room temperature (25 °C) without iR correction. The mean line represents the average of five independent measurements. Error bars represent standard deviation (SD). b Full cell and TMV polarization curves of QWs10 under pure water electrolysis at 60 °C. Error bars represent the standard deviations of three independent measurements. c Normalized physicochemical variables and their correlation with water dissociation activity. All parameters are scaled using min–max normalization. The right panel summarizes the Pearson correlation coefficients (r) between TMV and each variable, with color intensity indicating the magnitude of r. D, S, σ, ρ, O_v, −O_brH, and TMV denote particle diameter, specific surface area, electrical conductivity, density, oxygen-vacancy concentration, bridging hydroxyl groups associated with oxygen vacancies, and transmembrane voltage, respectively. d A schematic illustration of the designed water electrolyzer. e Long-term pure water electrolysis at 1.0 A cm⁻² and 60 °C using different gas diffusion electrodes (GDLs) and catalysts. GDLs employed include Toray 090 carbon paper (Toray-090), stainless steel fiber paper (SSFP), and platinum-coated titanium spacer (PTS). Source data for Fig. 4a–c and Fig. 4e are provided as a Source Data file.
Summary
This work links the specific locations of surface hydroxyls to the water dissociation pathways in bipolar membranes: characterization shows that bridging sites can be enriched by synthesis conditions, constrained ab initio calculations indicate that their proton transfer in the alkaline pathway is more favorable, and device experiments test the performance of the material after regulation. The DeePMD-kit potential supports long-time dynamic simulations of the SnO₂/water interface, revealing water-assisted oxygen-vacancy healing and hydroxyl formation. Structural characterization, atomic-scale dynamics, reaction barriers, and membrane performance together support the active-site role of bridging hydroxyls.