What Can DP Do Too? Machine-Learning Potential Decodes Local Framework Dynamics in the Ultra-Small-Pore MOF MIL-120(Al) CO₂ Adsorbent
In metal-organic frameworks, the narrower the channel, the more likely a small change in the positions of pore-wall atoms is to alter where guest molecules enter and reside. The channels of MIL-120(Al) are about 5.4 × 4.7 Å, and the hydrogen atoms of the bridging hydroxyl groups μ₂-OH can point in different directions. Conventional X-ray diffraction is insensitive to hydrogen positions; if adsorption simulations use only one static framework structure, these local variations may be overlooked.
Dong Fan from Chongqing Jiaotong University, Guillaume Maurin from the University of Montpellier in France, and their colleagues published a paper in Nature Communications titled “Decoding local framework dynamics in the ultra-small pore MOF MIL-120(Al) CO₂ adsorbent using machine-learning potential.” The authors combined density functional theory (DFT), a dedicated potential trained with DeePMD-kit, and adsorption simulations to examine whether hydroxyl orientations can interconvert, how CO₂ is affected by them, and how adsorption results change when framework relaxation is allowed.
Similar Crystal Structures Hide Different Channels
In MIL-120(Al), AlO₆ octahedra are connected along the channel direction, and μ₂-OH groups are located between adjacent structural units. By changing the orientations of four bridging hydroxyl groups in one unit cell, the authors constructed six representative structures, A–F, while keeping the framework skeleton the same (see Figure 1). The simulated X-ray diffraction patterns of these structures are nearly indistinguishable, yet they correspond to different hydrogen-atom environments on the pore walls.
DFT full relaxation calculations show that configuration A has the lowest energy and F the highest, with a difference of about 0.59 eV per unit cell. In configuration A, some hydroxyl groups point toward adjacent octahedral chains, forming an interconnected hydrogen-bond network; configurations such as F have different hydroxyl arrangements, with some groups pointing toward the channel. The lattice parameters of the six structures vary by about ±1.4% relative to the experimental values, and the volumes vary by about ±3.5%, but the main peaks of the calculated pore size distributions already fall at different positions of about 3.8–4.2 Å. For ultra-small pores, such a difference in effective pore size of less than 1 Å can still affect how CO₂ contacts the pore walls.
The phonon spectra predicted by the trained machine-learning potential (MLP) show no imaginary frequencies for the six configurations along the examined Brillouin-zone paths, supporting their dynamic stability; configuration A has the lowest static energy. Therefore, all six orientations are included in the subsequent barrier calculations and dynamic sampling to assess how different pore-wall structures participate in adsorption.
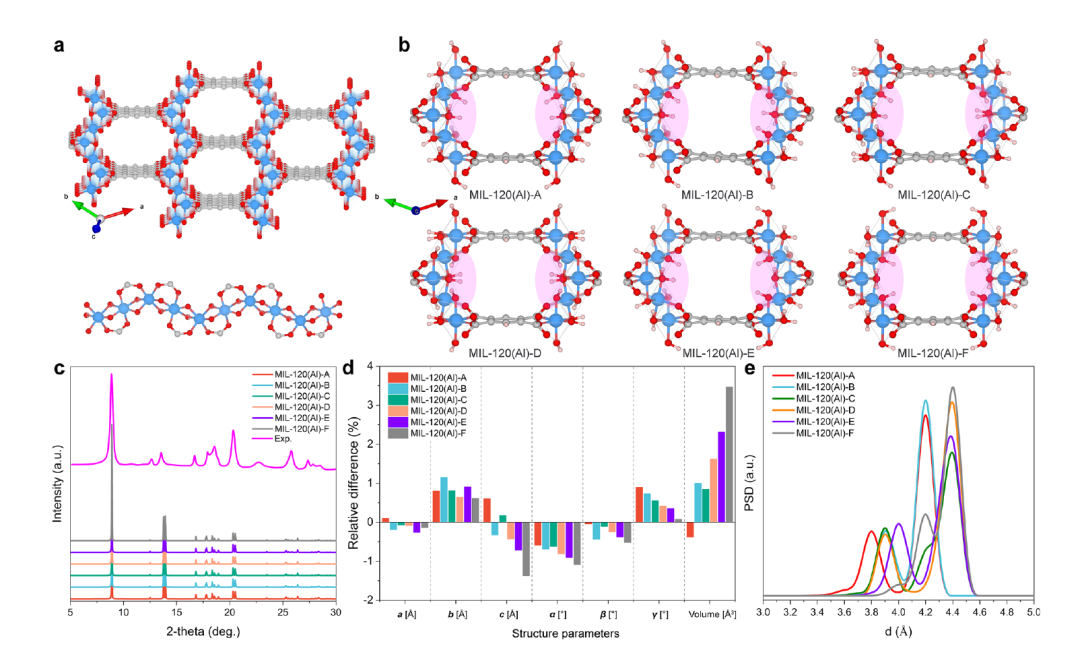
Figure 1 | The rich structure landscape of MIL-120(Al). a The crystal structure of MIL-120(Al) viewed along [001] direction highlighting the ultra-small 1D channel (top). Inorganic building blocks of the trans-cis edge-sharing Al(OH)₄O₂ octahedra along the direction of the MOF channel (bottom). H atoms were excluded for clarity. b Representation of the DFT-optimized structure models for the six variants of MIL-120(Al) with the different orientations of the μ₂-OH groups pointing towards the channel. The shadow area highlights the differences between the variants. Color code used in the structure models: Al, blue; O, red; C, gray; H, pink. c A comparison of the X-ray diffraction patterns for the DFT-optimized MIL-120(Al) configurations and the corresponding experimental data. d The percentage difference observed in the lattice parameters for the six MIL-120(Al) structures relative to the experimental values²⁵. e Computed pore size distributions (PSD) for the different DFT-optimized MIL-120(Al)s.
How DeePMD-kit Turns Local Orientations into Sampled Motion
Whether hydroxyl groups can reorient during adsorption requires tracking the actual motion of the framework. The research team collected DFT data including empty frameworks, different CO₂ loadings, transition configurations, and ab initio molecular dynamics (AIMD) trajectories, and used the DeepPot-SE framework in DeePMD-kit to train a dedicated potential for MIL-120(Al). The Methods section of the paper records that the training data contain 183,061 snapshots in total. This potential fits the system energy and atomic forces and drives the subsequent molecular dynamics and adsorption sampling.
The authors also examined equilibrium structures and reorientation pathways. For the empty framework and for structures with one CO₂ molecule adsorbed per unit cell, the root-mean-square errors of the potential energy predictions relative to DFT are 0.217 and 0.268 meV/atom, respectively. The energy–volume curves were compared with DFT, and the MLP-predicted phonon spectra were used to check dynamic stability. The study also calculated climbing-image nudged elastic band paths with both DFT and this potential to examine the transition regions traversed during hydroxyl reorientation. For several configuration interconversions in the empty framework, the barriers are about 0.07–0.19 eV per unit cell, and the paths and barriers obtained from the machine-learning potential agree closely with DFT (see Figure 3), supporting its use for tracking subsequent hydroxyl motion.
The paper also compared the same reorientation pathways when CO₂ was already present in the channels. For some of the examined pathways, interactions between the guest and the transition configuration lower the barriers by about 3%–8%. CO₂ in the pores thus alters the local reorientation process, and the changes in hydroxyl orientation in turn modify the adsorption sites available subsequently.
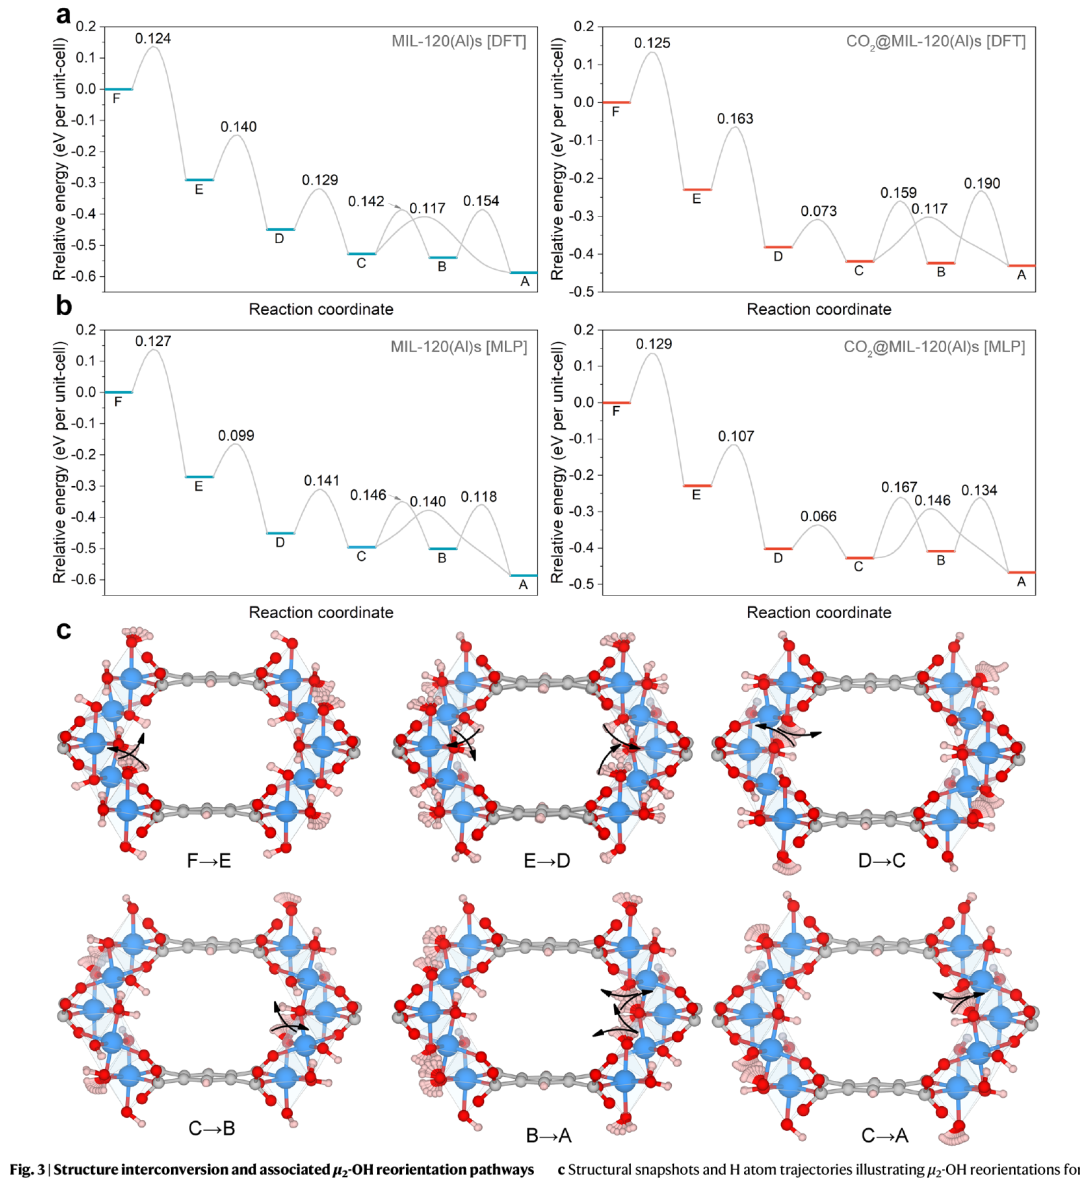
Figure 3 | Structure interconversion and associated μ₂-OH reorientation pathways of MIL-120(Al)s predicted by DFT- and MLP-CI-NEB calculations. a Representative CI-NEB profiles (in eV unit) for the empty (left) and CO₂-loaded (right) MIL-120(Al) structures using the DFT-CI-NEB approach. b Corresponding energy profiles using MLP-driven calculations that closely reproduce DFT barriers. c Structural snapshots and H atom trajectories illustrating μ₂-OH reorientations for six representative transition paths indicated in the figure. The black arrows indicate the directions in which the μ₂-OH orientation changes. Color code: Al, blue; O, red; C, gray; H, pink.
How Hydroxyl Reorientation Changes Where CO₂ Lands
The researchers first randomly inserted CO₂, used the machine-learning potential to locate low-energy adsorption sites, and then refined some structures with DFT. When hydroxyl groups point toward the channel, CO₂ can form directional contacts with them. In most of the examined configurations, the CO₂ molecular axis is nearly perpendicular to the channel direction, whereas the local environments of configurations C and D favor alignment along the channel direction. The calculated distances between the CO₂ oxygen and the μ₂-OH hydrogen are about 2.17–2.74 Å. Clearly, what changes is not only the magnitude of the adsorption energy but also the orientation of the adsorbed molecules.
Among the examined configurations, the maximum deviation of the CO₂ interaction energies predicted by the dedicated potential relative to DFT is about 2.3 kJ/mol. Figure 3b also compares two general-purpose MLPs at 0 K: according to the legend labels, MACE-MPA-0 predicts stronger interactions, while MACE-DAC predicts weaker ones. Another metric is the heat of adsorption: for some configurations, the dedicated potential gives results closer to the experimental values cited in the paper, whereas the classical UFF force field used for comparison overestimates the heat of adsorption. These comparisons show that a potential trained specifically for the polar pore walls and local flexibility of MIL-120(Al) can better describe the adsorption configurations considered.
From a Fixed Framework to Simultaneous Adsorption and Relaxation
Conventional grand canonical Monte Carlo (GCMC) adsorption simulations usually treat the framework as rigid, with both atomic positions and the unit cell fixed. The authors went further by alternating Monte Carlo insertions and deletions of CO₂ with molecular dynamics driven by the DeePMD potential: one scheme allows atomic motion but keeps the unit cell fixed, and another also allows the unit cell to change. The difference among the three schemes is precisely whether the framework can adjust local orientations and overall dimensions after guest molecules enter.
In GCMC–(NPT) MD simulations in which both atoms and the unit cell can relax, the isotherms starting from different initial hydroxyl configurations tend to converge, and they are also close to the isotherms of the A–D configurations in GCMC–(NVT) MD with a fixed unit cell. This is consistent with the framework relaxing toward the lower-energy A–D configurations after adsorption. Figure 4 of the paper compares the calculations at 303 K and 308 K over the 0–1 bar range with previously published experimental adsorption data. Molecular dynamics shows that the μ₂-OH groups of configuration F can reorient even without CO₂; at 300 K with CO₂, equilibrium is reached in about 200 ps at a loading of about 2.02 mmol/g, and in about 95 ps at about 4.05 mmol/g, indicating that higher guest loading can promote cooperative reorientation and shorten the transition time. Radial distribution functions compared with ab initio molecular dynamics further validate the model’s description of the interfacial nearest-neighbor structure.
The paper also points out that, compared with the fully rigid scheme, the scheme with a fixed unit cell but allowed atomic motion generally yields somewhat lower CO₂ uptakes, but the overall trend of uptake from F to A is still retained, especially at higher pressures; whether the unit cell as a whole can relax also affects the isotherms. Figure 4a labels one CO₂ molecule per unit cell as about 2.02 mmol/g (298 K); the radial distribution functions and dynamic snapshots in Figure 4f–h compare loadings of about 2.02 and 4.05 mmol/g at 300 K. Comparisons under these conditions link local hydroxyl motion, unit-cell relaxation, and changes in uptake.
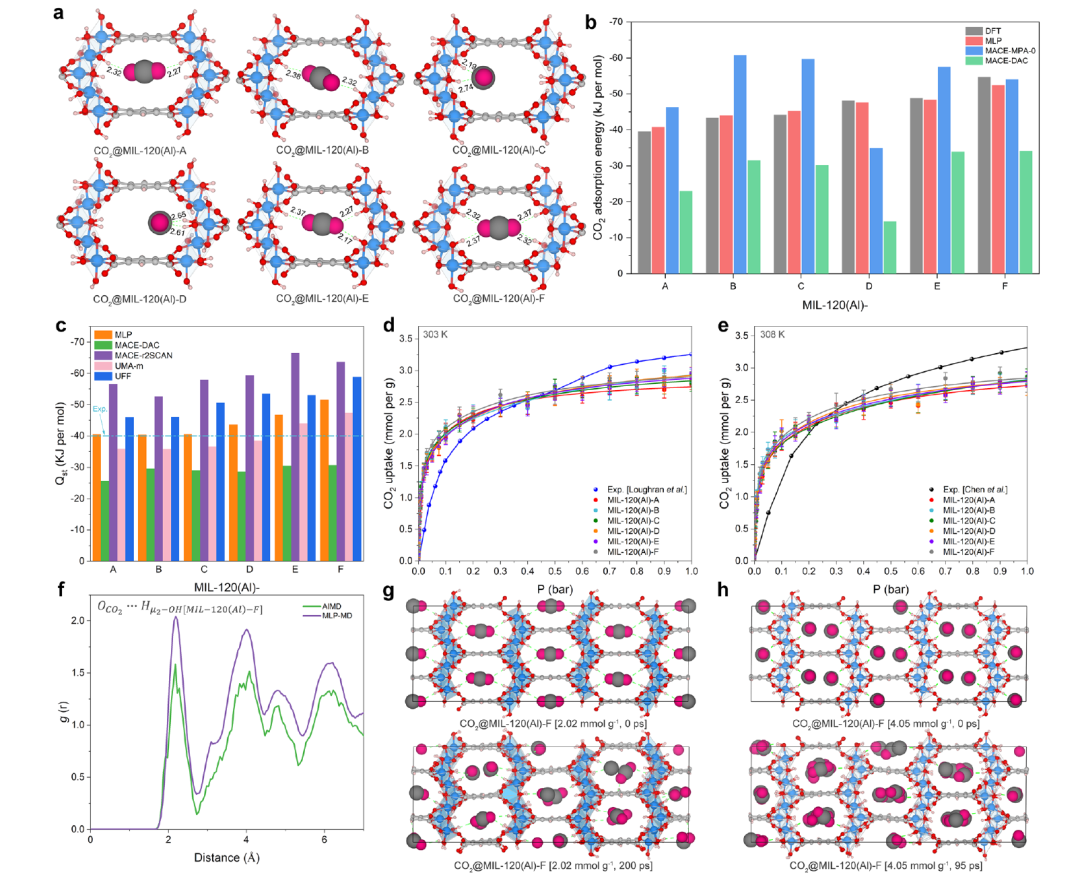
Figure 4 | In-depth microscopic understanding of the CO₂ adsorption in the diverse MIL-120(Al) configurations. a MLP-derived lowest-energy CO₂ adsorption sites in the different MIL-120(Al) structures for a loading of 1 molecule of CO₂ per unit cell (~2.02 mmol g⁻¹ at 298 K). The corresponding data for a loading of 2 molecules of CO₂ per unit cell (4.05 mmol g⁻¹ corresponding to the experimental uptake at 1 bar) are shown in Supplementary Fig. 29. The green dashed line represents the shortest distance between CO₂ and the μ₂-OH groups of MIL-120(Al) (unit: Å). b CO₂ interaction energies computed by DFT, our MLP model, and other MLPs including MACE-MPA-0 and MACE-DAC³²,³³, respectively. These interaction energies (E_int) were computed as E_int = E_CO₂@MOF − (E_MOF + E_CO₂) using the optimized CO₂ molecule, the optimized empty MIL-120(Al)s, and the optimized CO₂@MIL-120(Al)s at each theoretical level (MLP/DFT). c Widom-insertion derived isosteric heats (Q_st) at 298.15 K using our MLP, universal MLPs (including MACE-DAC³³, MACE-r²SCAN³⁴, UMA-m³⁵), and classical UFF³⁶ force field, respectively. The dashed line represents the experimental Q_st value reported earlier²⁵. GCMC simulated adsorption isotherms for CO₂ in MIL-120(Al)s at d 303 and e 308 K using MLP-based GCMC-MD (NPT) approach, respectively. Error bars represent the standard deviation calculated over the equilibrated part of the simulation. We collected the experimental data from two different literature sources for comparison²⁵,²⁶. f Radial distribution functions (RDF) for O_CO₂···H_μ₂-OH[MIL-120(Al)-F] atom pairs at 300 K computed via AIMD and MLP-MD approaches both in the NVT ensemble for a CO₂ loading of 2.02 mmol g⁻¹. g Representative MLP-MD snapshots for MIL-120-F loaded with 2.02 mmol g⁻¹ of CO₂, showing configurations at 0 ps (top) and 200 ps (bottom). h Representative MLP-MD snapshots for MIL-120-F loaded with 4.05 mmol g⁻¹ of CO₂, showing configurations at 0 ps (top) and 95 ps (bottom). The snapshots illustrate the rapid reorientation of pore-exposed μ₂–OH groups and the consequent reorganization of adsorbed CO₂ molecules. Color code for snapshots: Al, blue; O, red; C, gray; H, pink; CO₂, black and magenta for C and O respectively.
Summary
This study found that the hydroxyl orientations in MIL-120(Al), which are difficult to determine by conventional diffraction, change the effective pore size, the CO₂ adsorption sites, and the interactions. The dedicated potential trained with DeePMD-kit extends DFT reference accuracy to longer framework motion and adsorption sampling, making it possible to directly compare calculations with “a fixed structure” and those with “allowed local reorientation and overall relaxation.” It reveals the mechanism by which guest adsorption and local pore-wall motion are coupled in ultra-small-pore MOFs.
Article link:
https://doi.org/10.1038/s41467-026-69993-x