What Can ABACUS + DP Do Too? Interface-Controlled Phase Stability in Polymorphic HfO₂ Revealed by Machine-Learning Atomistic Simulations
1. Introduction
Recently, Zhu Xudong from the Institute of Artificial Intelligence, Hefei Comprehensive National Science Center, and Professor Lixin He’s team at the University of Science and Technology of China collaborated to publish a study titled “Interface-controlled phase stability in polymorphic HfO₂ revealed by machine-learning atomistic simulations” in npj Computational Materials. Based on the self-developed first-principles calculation software ABACUS, combined with Deep Potential (DP) machine-learning force fields and large-scale molecular dynamics simulations, the team revealed the important influence of interface orientation and lattice matching on the crystal phase selection, interface pinning, and phase transition pathways of hafnium oxide (HfO₂).
HfO₂ is an important dielectric material in advanced semiconductor devices, and its polar orthorhombic phase is ferroelectric. HfO₂ has several competing phases, including the monoclinic phase (M), tetragonal phase (T), polar orthorhombic phase (PO), and antipolar orthorhombic phase (AO). Although bulk free energy can reflect the phase stability relationships of ideal crystals, the actual evolution during phase coexistence is also affected by interface orientation, lattice matching, and local structural reconstruction. Understanding these factors is an important basis for using interface engineering to control metastable phases.
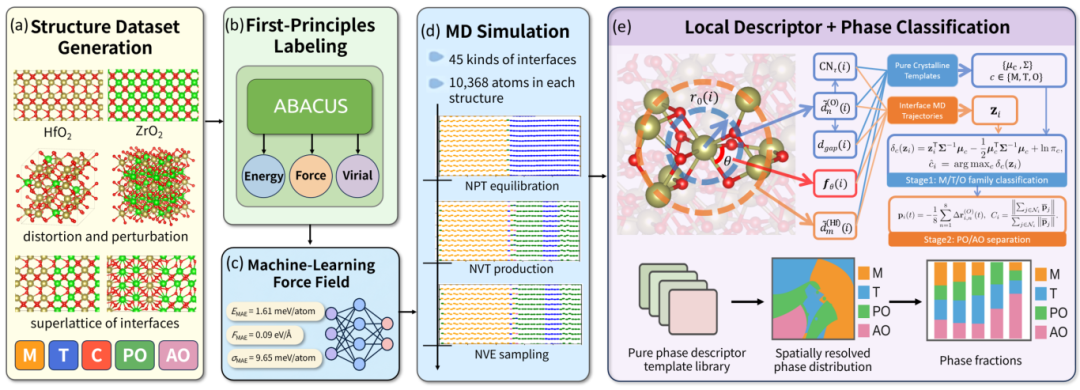
Figure 1: Computational workflow: configuration generation, ABACUS first-principles calculations, machine-learning force-field training, large-scale interface simulations, and local phase identification.
2. First-Principles-Driven Simulations at the Ten-Thousand-Atom Scale
The team used ABACUS to compute the energies, atomic forces, and virial quantities of different HfO₂ phases and related configurations, constructed DP force-field training data, and verified the force field’s accuracy for interface structures through independent first-principles calculations. ABACUS also provided computational support for bulk free-energy analysis.
On this basis, the team constructed 45 two-phase interface models with different orientations, each containing 10,368 atoms, and performed molecular dynamics simulations over the range of 300–1800 K, extending first-principles-supported atomistic simulations to ten-thousand-atom and nanosecond scales. At the same time, they used structural descriptors based on Hf local coordination and polar order to identify M, T, PO, and AO phases and to track their spatial distribution and evolution.
3. Interface Orientation Changes Phase Selection
The simulations found that, even with the same initial phase combination, different interface orientations led to markedly different evolutionary outcomes. Taking M/T interfaces at 300 K as an example, although the M phase has a lower bulk free energy, the M(100)/T(100) interface still maintained clear two-phase coexistence, whereas the M(001)/T(100) interface almost completely transformed into the M phase. Some orientations also produced reconstructed regions formed by local atomic rearrangement.
This indicates that phase evolution depends not only on the relative stability of bulk phases, but also on whether the interface can accommodate monoclinic shear, changes in Hf–O coordination, and rearrangement of the oxygen sublattice. Interface orientation and lattice matching can affect whether a phase transition occurs and how it propagates.
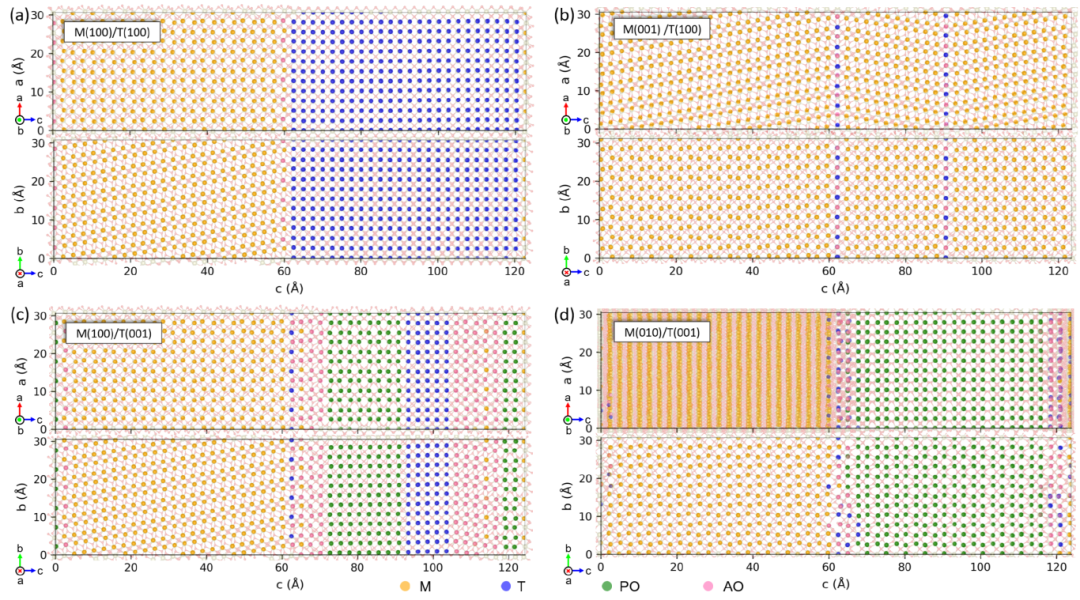
Figure 2: M/T interfaces with different orientations at 300 K exhibit two-phase coexistence, single-phase transformation, or local reconstruction.
4. Temperature Evolution and Interface Pinning
Through systematic simulations of 45 interfaces at different temperatures, the team found that phase evolution depends on both the initial phase combination and the interface orientation. At low temperatures, some interfaces can preserve two-phase coexistence; as the temperature increases, some interfaces gradually transform to the tetragonal phase. At 1800 K, all 21 interfaces initially without the M phase became predominantly T phase, whereas the 24 interfaces containing the M phase remained predominantly M phase, showing distinctly different temperature responses.
Further 3 ns simulations showed that the M(100)/T(100) interface maintained a mixed M/T state at 300, 900, and 1800 K, reflecting interface pinning effects within the simulation timescale. In contrast, the T(100)/PO(001) interface was predominantly PO phase at lower temperatures but predominantly T phase at 1800 K. These two types of interfaces demonstrate persistent two-phase coexistence and temperature-driven phase selection, respectively.
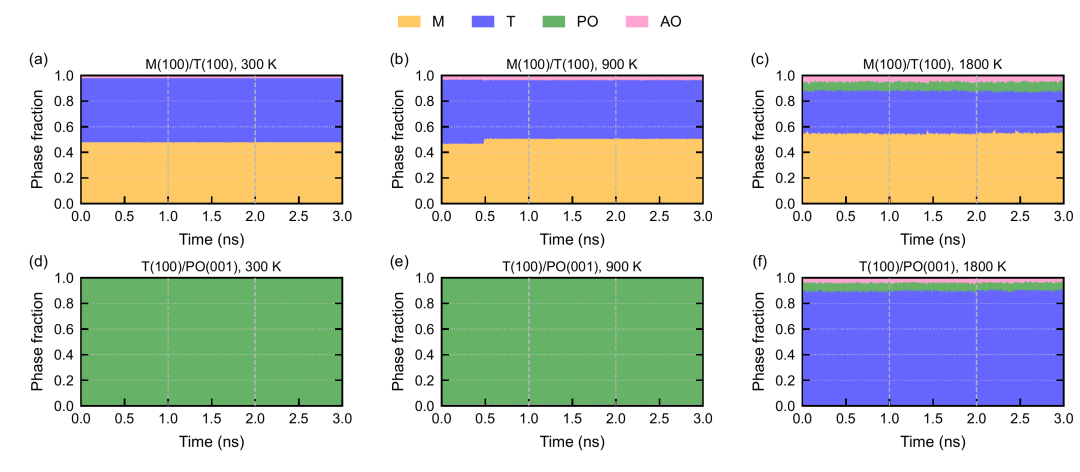
Figure 3: Three-nanosecond phase evolution of M(100)/T(100) and T(100)/PO(001) interfaces at different temperatures.
5. Interface-Mediated Low-Energy-Barrier Phase Transition Pathways
To further reveal the microscopic mechanism by which interfaces affect phase transitions, the team performed climbing-image nudged elastic band (NEB) calculations under fixed-lattice conditions. The results showed that larger simulation systems can accommodate the stepwise propagation of phase-transition fronts, giving rise to transition pathways that are difficult to describe with short-period cells.
For example, for the M(100)→T(100) transition, the energy barrier for direct cooperative transformation in a short cell with a length of 3 nm along the interface normal was 192.10 meV/f.u.; in a 12 nm long cell, the phase transition could proceed stepwise through interface states, and the highest energy barrier dropped to 136.03 meV/f.u., a reduction of about 29%. For the PO→AO and T→AO transitions, interface-mediated pathways also showed more significant barrier reductions.
This finding indicates that interfaces not only affect which phase ultimately forms, but can also change the feasible transformation pathways and energy barriers through local atomic reconstruction and phase-boundary propagation.
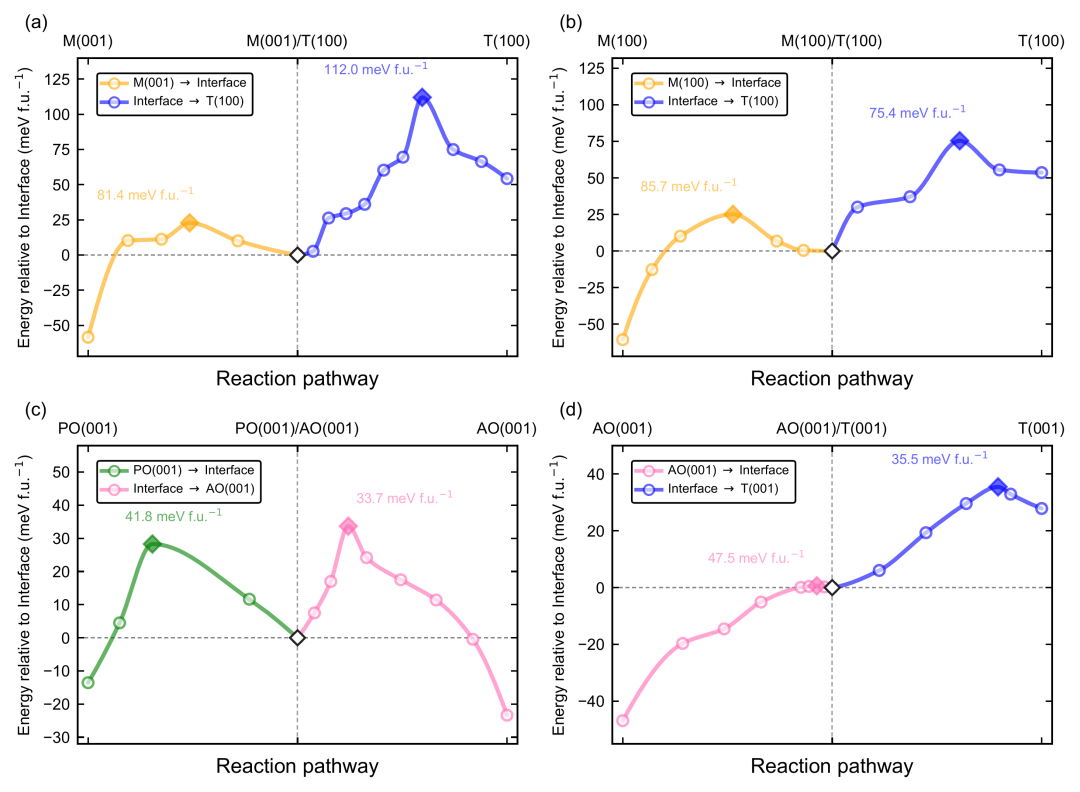
Figure 4: NEB transition pathways between representative interface states and pure phases. The energy unit meV/f.u. denotes energy per HfO₂ formula unit.
6. Summary
Based on ABACUS first-principles calculations, combined with DP machine-learning force fields and local phase identification methods, this study achieved simulations of complex interface phase transitions in HfO₂ at ten-thousand-atom and nanosecond scales. The work reveals the key roles of interface orientation and lattice matching in phase selection, interface pinning, and phase transition pathways, providing atomistic evidence for controlling metastable HfO₂ phases through interface engineering. This work also demonstrates the application potential of combining self-developed first-principles software with artificial intelligence methods for studying complex material interfaces and phase transition mechanisms.
7. Paper Information
Zhu, X., Li, J. & He, L. Interface-controlled phase stability in polymorphic HfO₂ revealed by machine-learning atomistic simulations. npj Computational Materials (2026).
Paper DOI: https://doi.org/10.1038/s41524-026-02353-x
The first author of this paper is Zhu Xudong from the Institute of Artificial Intelligence, Hefei Comprehensive National Science Center, and the corresponding authors are Zhu Xudong and Professor Lixin He from the University of Science and Technology of China. This work was supported by the Anhui Province Science and Technology Innovation Breakthrough Program, the operating funds of the Institute of Artificial Intelligence, and the Quantum Science and Technology Innovation Program. The computational work was carried out with support from the Supercomputing Center of the University of Science and Technology of China and the Hefei Advanced Computing Center.
ABACUS website: http://abacus.ustc.edu.cn
DeePMD website: https://deepmodeling.com/space/DeePMD-kit